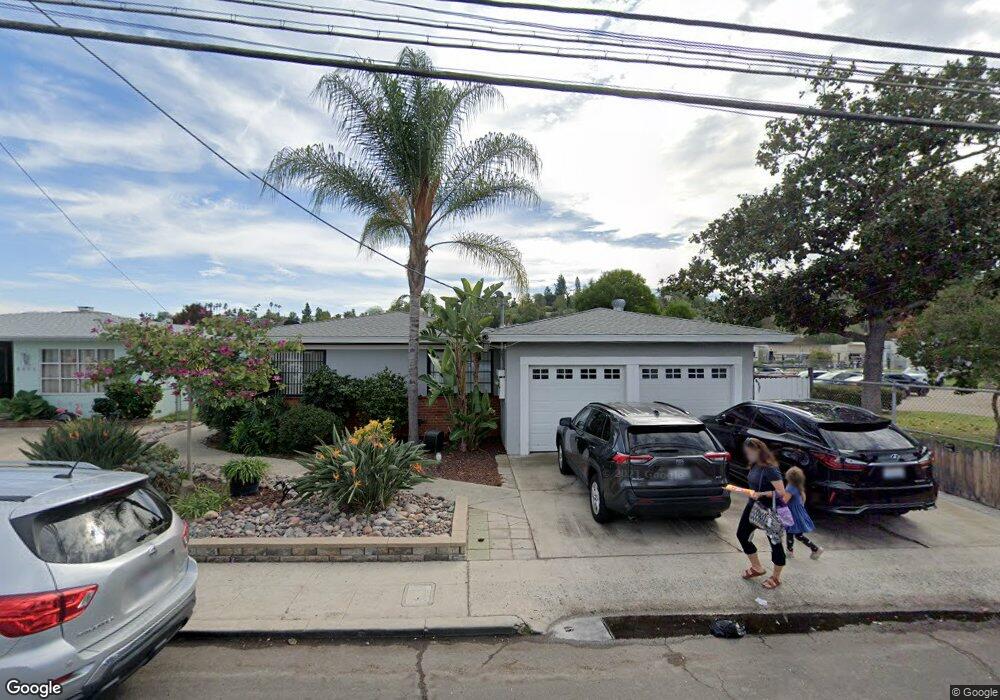
8841 Lemon Ave Unit 43 La Mesa, CA 91941
Estimated Value: $1,042,115 - $1,426,000
5
Beds
3
Baths
2,636
Sq Ft
$461/Sq Ft
Est. Value
About This Home
This home is located at 8841 Lemon Ave Unit 43, La Mesa, CA 91941 and is currently estimated at $1,215,529, approximately $461 per square foot. 8841 Lemon Ave Unit 43 is a home located in San Diego County with nearby schools including Lemon Avenue Elementary School, La Mesa Arts Academy, and Grossmont High School.
Ownership History
Date
Name
Owned For
Owner Type
Purchase Details
Closed on
Feb 13, 2023
Sold by
Smith Connie Lee
Bought by
Connie Lee Smith Living Trust
Current Estimated Value
Purchase Details
Closed on
Oct 24, 2013
Sold by
Smith Timothy J
Bought by
Smith Connie L
Home Financials for this Owner
Home Financials are based on the most recent Mortgage that was taken out on this home.
Original Mortgage
$322,000
Interest Rate
4.46%
Mortgage Type
New Conventional
Purchase Details
Closed on
May 2, 2006
Sold by
Smith Timothy J and Smith Connie L
Bought by
Smith Connie L
Purchase Details
Closed on
Jul 30, 1999
Sold by
Smith Connie L
Bought by
Smith Timothy J and Smith Connie L
Purchase Details
Closed on
Mar 18, 1983
Create a Home Valuation Report for This Property
The Home Valuation Report is an in-depth analysis detailing your home's value as well as a comparison with similar homes in the area
Purchase History
We collect this data history from publicly available records. To have your information removed, we recommend requesting removal directly through your county’s website.
| Date | Buyer | Sale Price | Title Company |
|---|---|---|---|
| Connie Lee Smith Living Trust | -- | -- | |
| Smith Connie L | -- | Chicago Title Company | |
| Smith Connie L | -- | Commonwealth Land Title Co | |
| Smith Timothy J | -- | Fidelity National Title Co | |
| -- | $126,500 | -- |
Source: Public Records
Mortgage History
We collect this data history from publicly available records. To have your information removed, we recommend requesting removal directly through your county’s website.
| Date | Status | Borrower | Loan Amount |
|---|---|---|---|
| Previous Owner | Smith Connie L | $322,000 |
Source: Public Records
Tax History
| Year | Tax Paid | Tax Assessment Tax Assessment Total Assessment is a certain percentage of the fair market value that is determined by local assessors to be the total taxable value of land and additions on the property. | Land | Improvement |
|---|---|---|---|---|
| 2025 | $3,861 | $262,055 | $103,576 | $158,479 |
| 2024 | $3,861 | $256,918 | $101,546 | $155,372 |
| 2023 | $3,693 | $251,881 | $99,555 | $152,326 |
| 2022 | $3,644 | $246,943 | $97,603 | $149,340 |
| 2021 | $3,595 | $242,102 | $95,690 | $146,412 |
| 2020 | $3,497 | $239,620 | $94,709 | $144,911 |
| 2019 | $3,432 | $234,922 | $92,852 | $142,070 |
| 2018 | $3,371 | $230,317 | $91,032 | $139,285 |
| 2017 | $50 | $225,802 | $89,248 | $136,554 |
| 2016 | $3,218 | $221,376 | $87,499 | $133,877 |
| 2015 | $3,222 | $218,052 | $86,185 | $131,867 |
| 2014 | $3,163 | $213,781 | $84,497 | $129,284 |
Source: Public Records
Map
Nearby Homes
- 8745 Glenira Ave
- 8870-78 La Mesa Blvd
- 4677 Garfield St
- 5010 Randlett Dr
- 4626-28 Edenvale Ave
- 9320 Fletcher Dr
- 8318-20 Allison Ave
- 0 Panorama Dr Unit 68
- 9365 Carmichael Dr
- 9350 Golondrina Dr
- 4413 Upland St
- 8245 Orchard Ave
- 9355 Lavell St
- 0 Echo Dr Unit 46
- 9200 Tropico Dr
- 6001 3-5 Horton Dr
- 0 El Granito Ave Unit PTP2603841
- 4701 Date Ave Unit 114
- 9364 Edgewood Dr
- 4516 Date Ave
- 8858 Lemon Ave
- 8849 Madison Ave
- 8839 Madison Ave
- 8833 Madison Ave
- 8855 Madison Ave
- 8878 Lemon Ave
- 8861-63 Lemon Ave
- 8861 Lemon Ave Unit 63
- 8851 Lemon Ave
- 8821 Madison Ave
- 8863 Madison Ave
- 8875 Lemon Ave
- 8871 Lemon Ave
- 8888 Lemon Ave
- 8885 Lemon Ave
- 8871 Madison Ave
- 8811 Madison Ave
- 8896 Lemon Ave
- 8848 Madison Ave
- 8838 Madison Ave
Your Personal Tour Guide
Ask me questions while you tour the home.