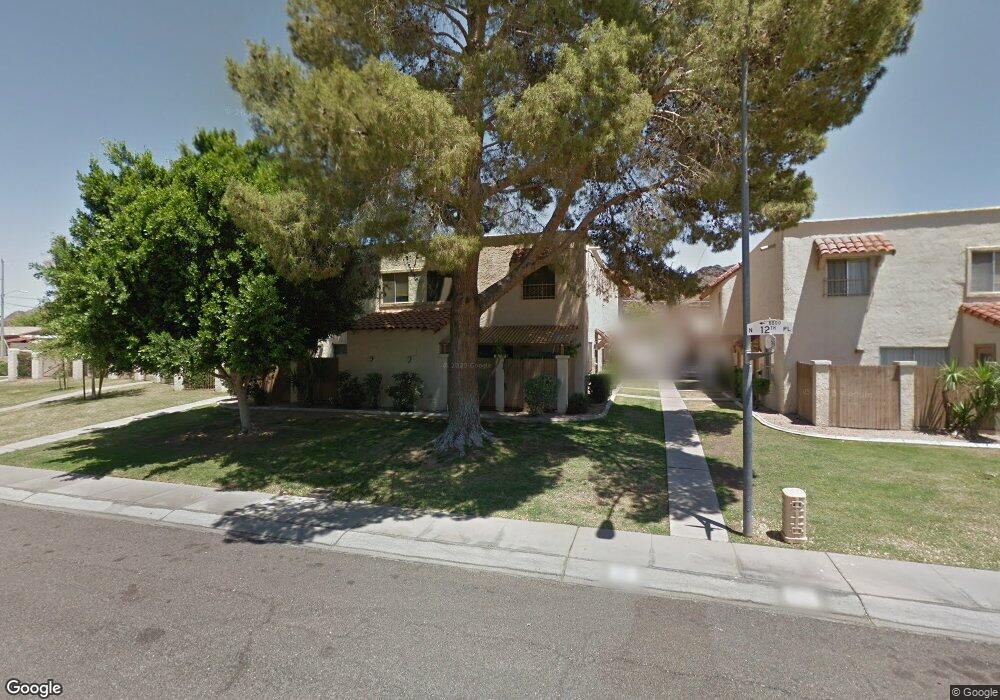
8843 N 12th Place Unit 41 Phoenix, AZ 85020
North Central NeighborhoodEstimated Value: $175,152 - $237,000
2
Beds
1
Bath
924
Sq Ft
$225/Sq Ft
Est. Value
About This Home
This home is located at 8843 N 12th Place Unit 41, Phoenix, AZ 85020 and is currently estimated at $208,288, approximately $225 per square foot. 8843 N 12th Place Unit 41 is a home located in Maricopa County with nearby schools including Desert View Elementary School, Royal Palm Middle School, and Sunnyslope High School.
Ownership History
Date
Name
Owned For
Owner Type
Purchase Details
Closed on
Mar 10, 2004
Sold by
Short Jeffery L
Bought by
Allen Roger G
Current Estimated Value
Home Financials for this Owner
Home Financials are based on the most recent Mortgage that was taken out on this home.
Original Mortgage
$65,305
Outstanding Balance
$29,921
Interest Rate
5.39%
Mortgage Type
VA
Estimated Equity
$178,367
Purchase Details
Closed on
Apr 17, 1995
Sold by
Hud
Bought by
Short Jeffery L
Purchase Details
Closed on
Jan 6, 1995
Sold by
Hud
Bought by
Short Jeffery L
Home Financials for this Owner
Home Financials are based on the most recent Mortgage that was taken out on this home.
Original Mortgage
$24,450
Interest Rate
9.29%
Mortgage Type
FHA
Purchase Details
Closed on
Jul 22, 1994
Sold by
Bank Of America Nt & Sa
Bought by
Hud
Purchase Details
Closed on
May 5, 1994
Sold by
Equitable Deed Company
Bought by
Bank Of America Nt & Sa
Create a Home Valuation Report for This Property
The Home Valuation Report is an in-depth analysis detailing your home's value as well as a comparison with similar homes in the area
Home Values in the Area
Average Home Value in this Area
Purchase History
| Date | Buyer | Sale Price | Title Company |
|---|---|---|---|
| Allen Roger G | $63,900 | Capital Title Agency Inc | |
| Short Jeffery L | -- | -- | |
| Short Jeffery L | -- | Security Title Agency | |
| Hud | -- | United Title | |
| Bank Of America Nt & Sa | -- | -- |
Source: Public Records
Mortgage History
| Date | Status | Borrower | Loan Amount |
|---|---|---|---|
| Open | Allen Roger G | $65,305 | |
| Previous Owner | Short Jeffery L | $24,450 |
Source: Public Records
Tax History Compared to Growth
Tax History
| Year | Tax Paid | Tax Assessment Tax Assessment Total Assessment is a certain percentage of the fair market value that is determined by local assessors to be the total taxable value of land and additions on the property. | Land | Improvement |
|---|---|---|---|---|
| 2025 | $429 | $3,848 | -- | -- |
| 2024 | $404 | $3,665 | -- | -- |
| 2023 | $404 | $13,300 | $2,660 | $10,640 |
| 2022 | $390 | $10,030 | $2,000 | $8,030 |
| 2021 | $400 | $9,420 | $1,880 | $7,540 |
| 2020 | $389 | $8,380 | $1,670 | $6,710 |
| 2019 | $382 | $7,370 | $1,470 | $5,900 |
| 2018 | $371 | $6,310 | $1,260 | $5,050 |
| 2017 | $370 | $5,780 | $1,150 | $4,630 |
| 2016 | $364 | $4,550 | $910 | $3,640 |
| 2015 | $337 | $3,530 | $700 | $2,830 |
Source: Public Records
Map
Nearby Homes
- 1307 E Dunlap Ave
- 1227 E Townley Ave
- 1229 E Townley Ave Unit 87
- 1224 E Dunlap Ave
- 1401 E Puget Ave Unit 24
- 1207 E Alice Ave
- 1145 E Eva St
- 8230 N 14th St Unit 2
- 9031 N 14th St
- 8916 N 11th St
- 9007 N 11th St Unit 35
- 8607 N 14th St Unit 229
- 8603 N 14th St
- 8911 N 10th St
- 9033 N 11th St
- 8921 N 10th St
- 9047 N 11th St
- 1114 E Orchid Ln
- 844 E Townley Ave
- 9015 N 15th Place
- 8849 N 12th Place
- 8845 N 12th Place Unit 44
- 8847 N 12th Place Unit 43
- 8841 N 12th Place Unit 38
- 8835 N 12th Place
- 8837 N 12th Place
- 8833 N 12th Place
- 8831 N 12th Place Unit 35
- 1142 N 12th Place Unit 24
- 1232 E Townley Ave Unit 57
- 8844 N 13th St
- 1231 E Townley Ave Unit 86
- 1230 E Townley Ave Unit 60
- 8829 N 12th Place
- 1226 E Townley Ave Unit 58
- 8836 N 13th St
- 1225 E Townley Ave Unit 85
- 8848 N 13th St
- 1228 E Townley Ave Unit 59
- 8853 N 12th Place