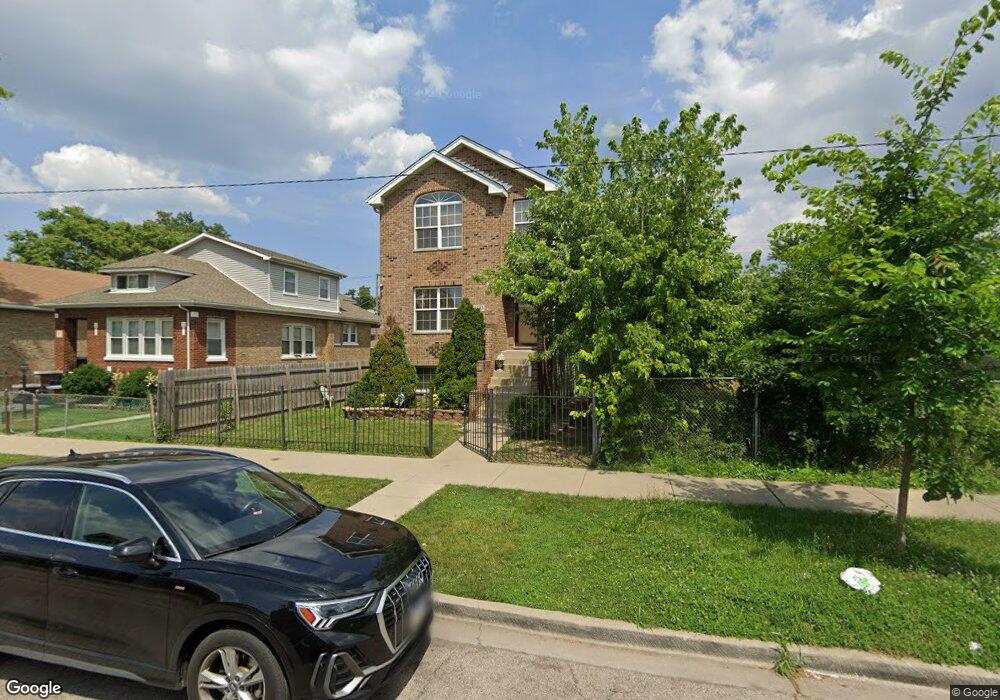
8843 S Emerald Ave Chicago, IL 60620
Auburn Gresham NeighborhoodEstimated Value: $334,000 - $392,000
4
Beds
4
Baths
3,100
Sq Ft
$116/Sq Ft
Est. Value
About This Home
This home is located at 8843 S Emerald Ave, Chicago, IL 60620 and is currently estimated at $359,768, approximately $116 per square foot. 8843 S Emerald Ave is a home located in Cook County with nearby schools including Ryder Elementary Math & Sci Spec School, Harlan Community Academy High School, and Hansberry College Prep.
Ownership History
Date
Name
Owned For
Owner Type
Purchase Details
Closed on
Apr 25, 2007
Sold by
Brosna Construction Inc
Bought by
Kirkman Cynthia
Current Estimated Value
Home Financials for this Owner
Home Financials are based on the most recent Mortgage that was taken out on this home.
Original Mortgage
$299,000
Outstanding Balance
$181,280
Interest Rate
6.2%
Mortgage Type
Purchase Money Mortgage
Estimated Equity
$178,488
Purchase Details
Closed on
Aug 11, 2005
Sold by
Discount Inn Inc
Bought by
Brosna Construction Inc
Purchase Details
Closed on
Dec 20, 2004
Sold by
Orr David D
Bought by
Discount Inn Inc
Purchase Details
Closed on
Sep 11, 1996
Sold by
Beneficial Illinois Inc
Bought by
Thompkins Eddie C and Thompkins Carol R
Purchase Details
Closed on
Jan 23, 1996
Sold by
Sheahan Michael F
Bought by
Beneficial Illinois Inc and Beneficial Mtg Company Of Illinois
Create a Home Valuation Report for This Property
The Home Valuation Report is an in-depth analysis detailing your home's value as well as a comparison with similar homes in the area
Home Values in the Area
Average Home Value in this Area
Purchase History
| Date | Buyer | Sale Price | Title Company |
|---|---|---|---|
| Kirkman Cynthia | $300,000 | Cti | |
| Brosna Construction Inc | $110,000 | Chicago Title Insurance Comp | |
| Discount Inn Inc | -- | -- | |
| Thompkins Eddie C | $25,000 | -- | |
| Beneficial Illinois Inc | -- | -- |
Source: Public Records
Mortgage History
| Date | Status | Borrower | Loan Amount |
|---|---|---|---|
| Open | Kirkman Cynthia | $299,000 |
Source: Public Records
Tax History Compared to Growth
Tax History
| Year | Tax Paid | Tax Assessment Tax Assessment Total Assessment is a certain percentage of the fair market value that is determined by local assessors to be the total taxable value of land and additions on the property. | Land | Improvement |
|---|---|---|---|---|
| 2024 | $3,529 | $25,000 | $5,016 | $19,984 |
| 2023 | $3,420 | $20,000 | $3,960 | $16,040 |
| 2022 | $3,420 | $20,000 | $3,960 | $16,040 |
| 2021 | $3,362 | $20,000 | $3,960 | $16,040 |
| 2020 | $2,279 | $13,309 | $3,960 | $9,349 |
| 2019 | $2,255 | $14,626 | $3,960 | $10,666 |
| 2018 | $2,216 | $14,626 | $3,960 | $10,666 |
| 2017 | $3,035 | $17,441 | $3,432 | $14,009 |
| 2016 | $3,000 | $17,441 | $3,432 | $14,009 |
| 2015 | $2,722 | $17,441 | $3,432 | $14,009 |
| 2014 | $2,538 | $16,213 | $3,168 | $13,045 |
| 2013 | $2,476 | $16,213 | $3,168 | $13,045 |
Source: Public Records
Map
Nearby Homes
- 8853 S Halsted St
- 8805 S Union Ave
- 8940 S Emerald Ave
- 8926 S Lowe Ave
- 8913 S Lowe Ave
- 8807 S Lowe Ave
- 8852 S Wallace St
- 8943 S Lowe Ave
- 8855 S Wallace St
- 738 W 87th St
- 8851 S Parnell Ave
- 8907 S Parnell Ave
- 8636 S Union Ave
- 8900 S Normal Ave
- 8629 S Union Ave
- 8616 S Emerald Ave
- 8817 S Morgan St
- 9133 S Halsted St
- 9001-9003 S Wallace St
- 9117 S Wallace St
- 8847 S Emerald Ave
- 8849 S Emerald Ave
- 8841 S Emerald Ave
- 8837 S Emerald Ave
- 8857 S Emerald Ave
- 8833 S Emerald Ave
- 8844 S Union Ave
- 8846 S Union Ave
- 8852 S Union Ave
- 8836 S Union Ave
- 8834 S Union Ave
- 8856 S Union Ave
- 8832 S Union Ave
- 8846 S Emerald Ave
- 8830 S Union Ave
- 8844 S Emerald Ave
- 8850 S Emerald Ave
- 8840 S Emerald Ave
- 8852 S Emerald Ave