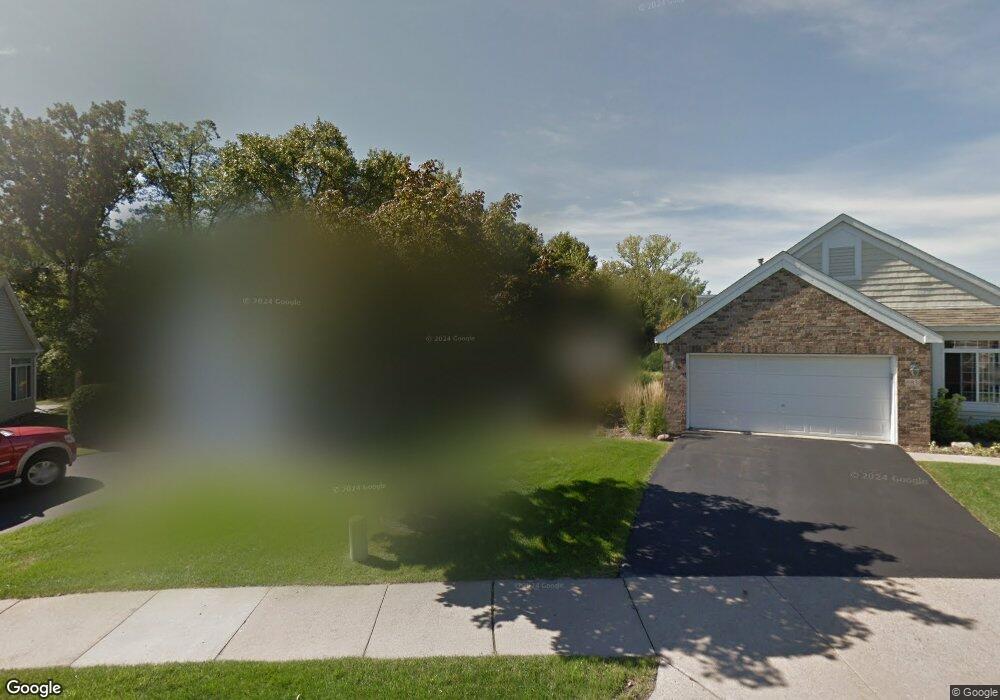
8845 Coffman Path Inver Grove Heights, MN 55076
Estimated Value: $338,000 - $381,000
2
Beds
2
Baths
1,484
Sq Ft
$244/Sq Ft
Est. Value
About This Home
This home is located at 8845 Coffman Path, Inver Grove Heights, MN 55076 and is currently estimated at $361,386, approximately $243 per square foot. 8845 Coffman Path is a home located in Dakota County with nearby schools including Pine Bend Elementary School, Inver Grove Heights Middle School, and Simley Senior High School.
Ownership History
Date
Name
Owned For
Owner Type
Purchase Details
Closed on
Mar 10, 2021
Sold by
Engebretson Jane Ann and Jane Ann Engebretson Revocable
Bought by
Billmark Kayla and The Gordie R Billmark Revocabl
Current Estimated Value
Purchase Details
Closed on
Oct 23, 2013
Sold by
Nelson Jane A and Engebretson Douglas R
Bought by
Engebretson Jane Ann and Jane Ann Engebretson Revocable Trust
Purchase Details
Closed on
May 11, 2007
Sold by
Proops Kevin Richard and Anderson Sandra Jean
Bought by
Nelson Jane A
Purchase Details
Closed on
Jun 14, 2002
Sold by
Hurley Melissa A
Bought by
Kendseth Thomas J and Kendseth Lois A
Purchase Details
Closed on
Oct 1, 2001
Sold by
Espie Christina L
Bought by
Proops Kevin R
Purchase Details
Closed on
Jun 29, 1998
Sold by
The Rottlund Company Inc
Bought by
Espie Christina L
Create a Home Valuation Report for This Property
The Home Valuation Report is an in-depth analysis detailing your home's value as well as a comparison with similar homes in the area
Home Values in the Area
Average Home Value in this Area
Purchase History
| Date | Buyer | Sale Price | Title Company |
|---|---|---|---|
| Billmark Kayla | $329,500 | Burnet Title | |
| Engebretson Jane Ann | -- | None Available | |
| Nelson Jane A | $268,000 | -- | |
| Kendseth Thomas J | $221,000 | -- | |
| Proops Kevin R | $196,000 | -- | |
| Espie Christina L | $149,900 | -- | |
| Billmark Kayla Kayla | $329,500 | -- |
Source: Public Records
Tax History Compared to Growth
Tax History
| Year | Tax Paid | Tax Assessment Tax Assessment Total Assessment is a certain percentage of the fair market value that is determined by local assessors to be the total taxable value of land and additions on the property. | Land | Improvement |
|---|---|---|---|---|
| 2024 | $2,874 | $290,500 | $64,300 | $226,200 |
| 2023 | $2,888 | $288,200 | $64,700 | $223,500 |
| 2022 | $2,694 | $291,400 | $64,600 | $226,800 |
| 2021 | $2,788 | $254,400 | $56,200 | $198,200 |
| 2020 | $2,598 | $258,000 | $53,500 | $204,500 |
| 2019 | $2,448 | $241,800 | $51,000 | $190,800 |
| 2018 | $2,170 | $215,600 | $47,200 | $168,400 |
| 2017 | $2,213 | $192,900 | $43,700 | $149,200 |
| 2016 | $2,182 | $192,200 | $41,600 | $150,600 |
| 2015 | $2,121 | $168,443 | $35,349 | $133,094 |
| 2014 | -- | $153,074 | $31,912 | $121,162 |
| 2013 | -- | $139,558 | $28,910 | $110,648 |
Source: Public Records
Map
Nearby Homes
- 8827 Coffman Path
- 8770 Benson Way Unit 82
- TBd Cahill Blvd Blvd
- 3853 90th St E
- 8590 Corcoran Path
- 8550 Corcoran Path
- 8361 Carew Ct
- 8816 Brunell Way Unit 404
- 8904 Brunswick Path Unit 2104
- 8355 Cooper Way
- 8336 Cloman Ave
- 8124 Clifford Cir
- 8381 Corcoran Cir Unit 49
- 8789 Branson Dr Unit 72
- 9649-9665 Cedarwood Ct
- 3750 80th St E
- 3295 80th St E Unit 508
- 8104 Dana Path
- 8086 Dana Path
- 7949 Cooper Ave E
- 8831 Coffman Path
- 8895 Coffman Path
- 8911 Coffman Path
- 8832 Coffman Path
- 8852 Coffman Path
- 8919 Coffman Path
- 8927 Coffman Path
- 8807 Compton Ln
- 8908 Coffman Path
- 8916 Coffman Path
- 8939 Coffman Path
- 8811 Compton Dr
- 8926 Coffman Path
- 8825 Coffman Path
- 8850 Compton Ln
- 8828 Coffman Path
- 8934 Coffman Path
- 8813 Compton Dr
- 8813 Compton Dr
- 8826 Coffman Path