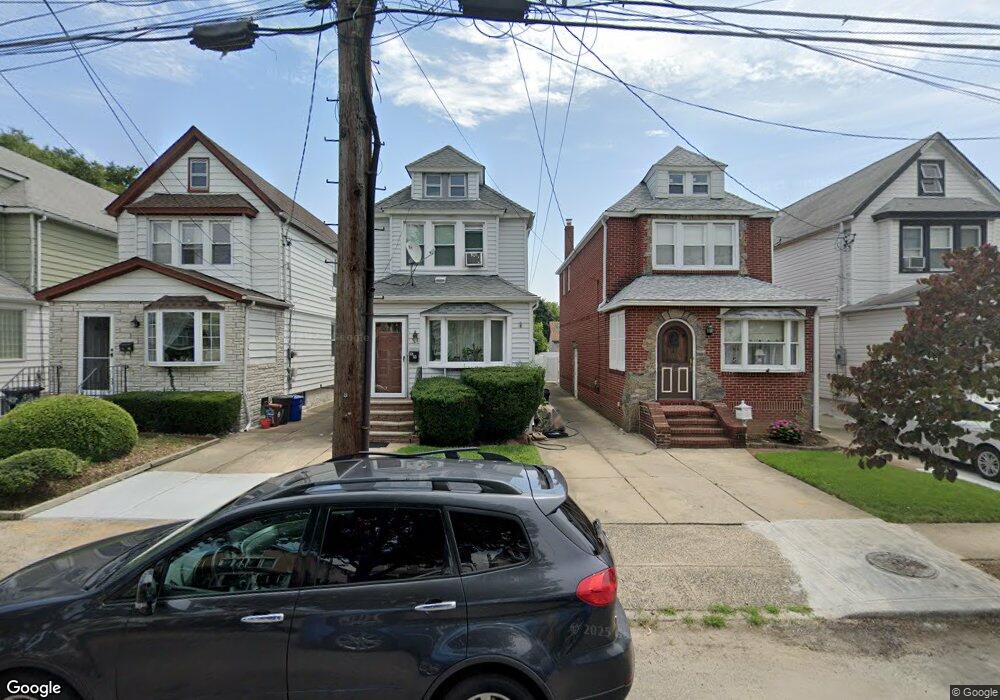
8853 247th St Bellerose, NY 11426
Bellerose NeighborhoodEstimated Value: $686,268 - $779,000
--
Bed
--
Bath
1,248
Sq Ft
$597/Sq Ft
Est. Value
About This Home
This home is located at 8853 247th St, Bellerose, NY 11426 and is currently estimated at $745,067, approximately $597 per square foot. 8853 247th St is a home located in Queens County with nearby schools including P.S.133Q, Irwin Altman Middle School 172, and Martin Van Buren High School.
Ownership History
Date
Name
Owned For
Owner Type
Purchase Details
Closed on
Mar 8, 2022
Sold by
Reives Elba I and Reives Lenard A
Bought by
Reives Lenard
Current Estimated Value
Purchase Details
Closed on
Dec 22, 2003
Sold by
Sende Alexandra B and Sende Horacio H
Bought by
Reives Elba I and Reives Lenard A
Home Financials for this Owner
Home Financials are based on the most recent Mortgage that was taken out on this home.
Original Mortgage
$288,800
Interest Rate
5.62%
Mortgage Type
Purchase Money Mortgage
Purchase Details
Closed on
May 29, 2002
Sold by
Goode Denis and Goode Hugh
Bought by
Sende Alexandera B
Home Financials for this Owner
Home Financials are based on the most recent Mortgage that was taken out on this home.
Original Mortgage
$265,533
Interest Rate
6.73%
Purchase Details
Closed on
Nov 20, 2001
Sold by
Goode Beatrice
Bought by
Goode Denis and Goode Robert
Create a Home Valuation Report for This Property
The Home Valuation Report is an in-depth analysis detailing your home's value as well as a comparison with similar homes in the area
Home Values in the Area
Average Home Value in this Area
Purchase History
| Date | Buyer | Sale Price | Title Company |
|---|---|---|---|
| Reives Lenard | -- | -- | |
| Reives Elba I | $361,000 | -- | |
| Sende Alexandera B | -- | -- | |
| Goode Denis | -- | -- |
Source: Public Records
Mortgage History
| Date | Status | Borrower | Loan Amount |
|---|---|---|---|
| Previous Owner | Reives Elba I | $288,800 | |
| Previous Owner | Sende Alexandera B | $265,533 | |
| Closed | Reives Elba I | $72,200 |
Source: Public Records
Tax History Compared to Growth
Tax History
| Year | Tax Paid | Tax Assessment Tax Assessment Total Assessment is a certain percentage of the fair market value that is determined by local assessors to be the total taxable value of land and additions on the property. | Land | Improvement |
|---|---|---|---|---|
| 2025 | $5,872 | $30,954 | $9,386 | $21,568 |
| 2024 | $5,872 | $29,237 | $9,061 | $20,176 |
| 2023 | $5,613 | $27,946 | $9,329 | $18,617 |
| 2022 | $5,321 | $39,060 | $13,500 | $25,560 |
| 2021 | $5,610 | $40,860 | $13,500 | $27,360 |
| 2020 | $5,460 | $37,320 | $13,500 | $23,820 |
| 2019 | $5,097 | $33,660 | $13,500 | $20,160 |
| 2018 | $4,747 | $23,288 | $10,155 | $13,133 |
| 2017 | $4,528 | $22,213 | $10,771 | $11,442 |
| 2016 | $4,441 | $22,213 | $10,771 | $11,442 |
| 2015 | $2,308 | $21,496 | $11,969 | $9,527 |
| 2014 | $2,308 | $20,304 | $13,082 | $7,222 |
Source: Public Records
Map
Nearby Homes
- 244-59 89th Ave
- 88-19 247th St
- 24432 90th Ave
- 248-29 88th Rd
- 87-01 Commonwealth Blvd
- 246-31 87th Ave
- 246-62 87th Ave
- 24607 87th Ave
- 248-43 88th Rd
- 37 Massachusetts Blvd
- 246-59 86th Rd
- 24134 87th Ave
- 8618 248th St
- 8724 250th St
- 93-24 243rd St
- 241-05 87th Ave
- 9240 245th St
- 241-10 86th Ave
- 8748 252nd St
- 2 Michigan Rd