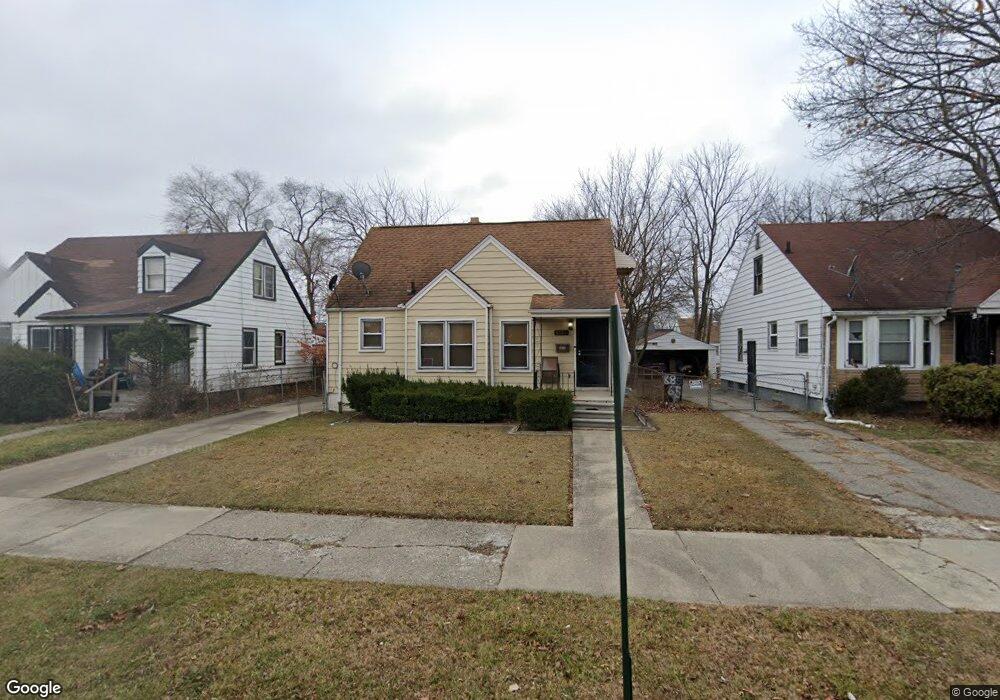
8853 Pierson St Detroit, MI 48228
Franklin Park NeighborhoodEstimated Value: $80,000 - $109,864
3
Beds
1
Bath
1,150
Sq Ft
$86/Sq Ft
Est. Value
About This Home
This home is located at 8853 Pierson St, Detroit, MI 48228 and is currently estimated at $98,466, approximately $85 per square foot. 8853 Pierson St is a home located in Wayne County with nearby schools including Bates Academy, Charles L. Spain Elementary-Middle School, and Edward 'Duke' Ellington Conservatory of Music and Art.
Ownership History
Date
Name
Owned For
Owner Type
Purchase Details
Closed on
Oct 6, 2008
Sold by
Litt Michael
Bought by
Moore Derick
Current Estimated Value
Purchase Details
Closed on
Apr 29, 2008
Sold by
Trott & Trott Pc
Bought by
Litt Michael
Purchase Details
Closed on
Aug 24, 2007
Sold by
Mortgage Electronic Registration Systems
Bought by
Federal National Mortgage Association
Purchase Details
Closed on
Jun 27, 2007
Sold by
Spicher George W and Spicher Celeste M
Bought by
Mortgage Electronic Registration Systems
Create a Home Valuation Report for This Property
The Home Valuation Report is an in-depth analysis detailing your home's value as well as a comparison with similar homes in the area
Home Values in the Area
Average Home Value in this Area
Purchase History
| Date | Buyer | Sale Price | Title Company |
|---|---|---|---|
| Moore Derick | $73,000 | Clearly Title | |
| Litt Michael | $9,250 | Warranty Title Agency Llc | |
| Federal National Mortgage Association | -- | None Available | |
| Mortgage Electronic Registration Systems | $40,629 | None Available |
Source: Public Records
Tax History Compared to Growth
Tax History
| Year | Tax Paid | Tax Assessment Tax Assessment Total Assessment is a certain percentage of the fair market value that is determined by local assessors to be the total taxable value of land and additions on the property. | Land | Improvement |
|---|---|---|---|---|
| 2025 | $927 | $33,200 | $0 | $0 |
| 2024 | $927 | $27,700 | $0 | $0 |
| 2023 | $898 | $22,300 | $0 | $0 |
| 2022 | $976 | $17,100 | $0 | $0 |
| 2021 | $953 | $13,300 | $0 | $0 |
| 2020 | $944 | $12,200 | $0 | $0 |
| 2019 | $931 | $10,900 | $0 | $0 |
| 2018 | $804 | $9,900 | $0 | $0 |
| 2017 | $178 | $9,400 | $0 | $0 |
| 2016 | $1,026 | $13,000 | $0 | $0 |
| 2015 | $1,300 | $13,000 | $0 | $0 |
| 2013 | $1,826 | $18,264 | $0 | $0 |
| 2010 | -- | $26,169 | $998 | $25,171 |
Source: Public Records
Map
Nearby Homes