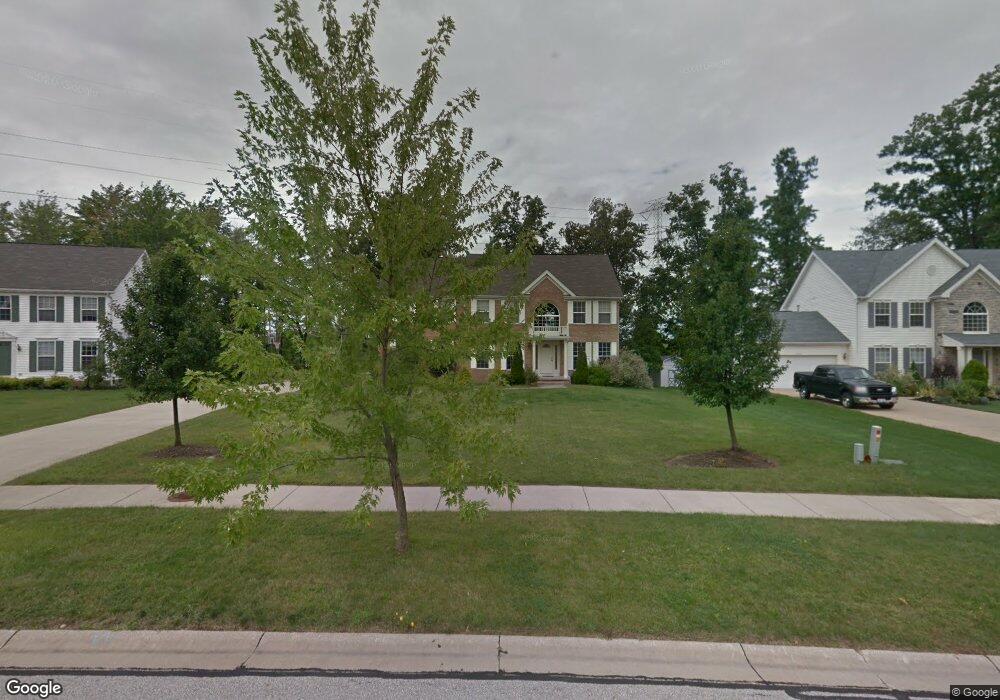
8854 Langston Ct MacEdonia, OH 44056
Estimated Value: $424,000 - $475,000
3
Beds
3
Baths
2,615
Sq Ft
$169/Sq Ft
Est. Value
About This Home
This home is located at 8854 Langston Ct, MacEdonia, OH 44056 and is currently estimated at $442,127, approximately $169 per square foot. 8854 Langston Ct is a home located in Summit County with nearby schools including Lee Eaton Elementary School, Nordonia Middle School, and Nordonia High School.
Ownership History
Date
Name
Owned For
Owner Type
Purchase Details
Closed on
Dec 1, 2015
Sold by
Crossroads Group Llc
Bought by
Malloy Kiesha K
Current Estimated Value
Home Financials for this Owner
Home Financials are based on the most recent Mortgage that was taken out on this home.
Original Mortgage
$157,500
Outstanding Balance
$124,054
Interest Rate
3.75%
Mortgage Type
New Conventional
Estimated Equity
$318,073
Purchase Details
Closed on
Nov 18, 2008
Sold by
Wells Fargo Bank Na
Bought by
Crossroads Group Llc
Purchase Details
Closed on
Jun 11, 2008
Sold by
Watkins Linda J
Bought by
Wells Fargo Bank Na and Certificateholders Of Asset Backed Pass
Purchase Details
Closed on
Dec 1, 2003
Sold by
The Drees Co
Bought by
Watkins Lowell O and Watkins Linda J
Home Financials for this Owner
Home Financials are based on the most recent Mortgage that was taken out on this home.
Original Mortgage
$284,630
Interest Rate
8.07%
Mortgage Type
Purchase Money Mortgage
Create a Home Valuation Report for This Property
The Home Valuation Report is an in-depth analysis detailing your home's value as well as a comparison with similar homes in the area
Home Values in the Area
Average Home Value in this Area
Purchase History
| Date | Buyer | Sale Price | Title Company |
|---|---|---|---|
| Malloy Kiesha K | $175,000 | Competitve Title | |
| Crossroads Group Llc | $200,000 | Attorney | |
| Wells Fargo Bank Na | $210,000 | None Available | |
| Watkins Lowell O | $299,611 | Midland Commerce Group |
Source: Public Records
Mortgage History
| Date | Status | Borrower | Loan Amount |
|---|---|---|---|
| Open | Malloy Kiesha K | $157,500 | |
| Previous Owner | Watkins Lowell O | $284,630 |
Source: Public Records
Tax History
| Year | Tax Paid | Tax Assessment Tax Assessment Total Assessment is a certain percentage of the fair market value that is determined by local assessors to be the total taxable value of land and additions on the property. | Land | Improvement |
|---|---|---|---|---|
| 2024 | $5,993 | $135,468 | $18,351 | $117,117 |
| 2023 | $5,993 | $135,468 | $18,351 | $117,117 |
| 2022 | $5,869 | $108,560 | $14,683 | $93,877 |
| 2021 | $5,887 | $108,560 | $14,683 | $93,877 |
| 2020 | $5,779 | $108,560 | $14,680 | $93,880 |
| 2019 | $5,684 | $96,310 | $16,640 | $79,670 |
| 2018 | $4,895 | $96,310 | $16,640 | $79,670 |
| 2017 | $5,265 | $96,310 | $16,640 | $79,670 |
| 2016 | $5,093 | $93,140 | $16,640 | $76,500 |
| 2015 | $5,265 | $93,140 | $16,640 | $76,500 |
| 2014 | $5,198 | $93,140 | $16,640 | $76,500 |
| 2013 | $5,278 | $95,430 | $16,640 | $78,790 |
Source: Public Records
Map
Nearby Homes
- V/L Meadow Ln
- 8697 Kingfisher Ln
- 8690 Foxwood Cir Unit 225
- 8683 Pine Creek Ln Unit 15
- 9185 Milford Dr
- 214 Heights Ave
- 256 Monroe Dr
- 321 Stone Bridge Dr
- 80 Canter Ln Unit C
- 307 Washington Dr
- 9505 N Bedford Rd Unit Lot 28
- 8208 Cyrus Ln
- 8191 Cyrus Ln
- 8546 Shorthorn Dr
- 8800 Lawton Dr
- 8134 N Boyden Rd
- 17759 S Meadowpark Dr
- 7967 N Gannett Rd
- 7602 Hickory Rd
- 1159 Park Ledge Dr
- 8864 Langston Ct
- 8846 Langston Ct
- 8874 Langston Ct
- 8838 Langston Ct
- 8851 Langston Ct
- 8884 Langston Ct
- 8863 Langston Ct
- 8841 Langston Ct
- 8873 Langston Ct
- 8830 Langston Ct
- 8894 Langston Ct
- 8822 Langston Ct
- 8883 Langston Ct
- 8831 Langston Ct
- 8893 Langston Ct
- 8906 Langston Ct
- 10040 Firestone Ln
- 10050 Firestone Ln
- 10030 Firestone Ln
- 10060 Firestone Ln
Your Personal Tour Guide
Ask me questions while you tour the home.