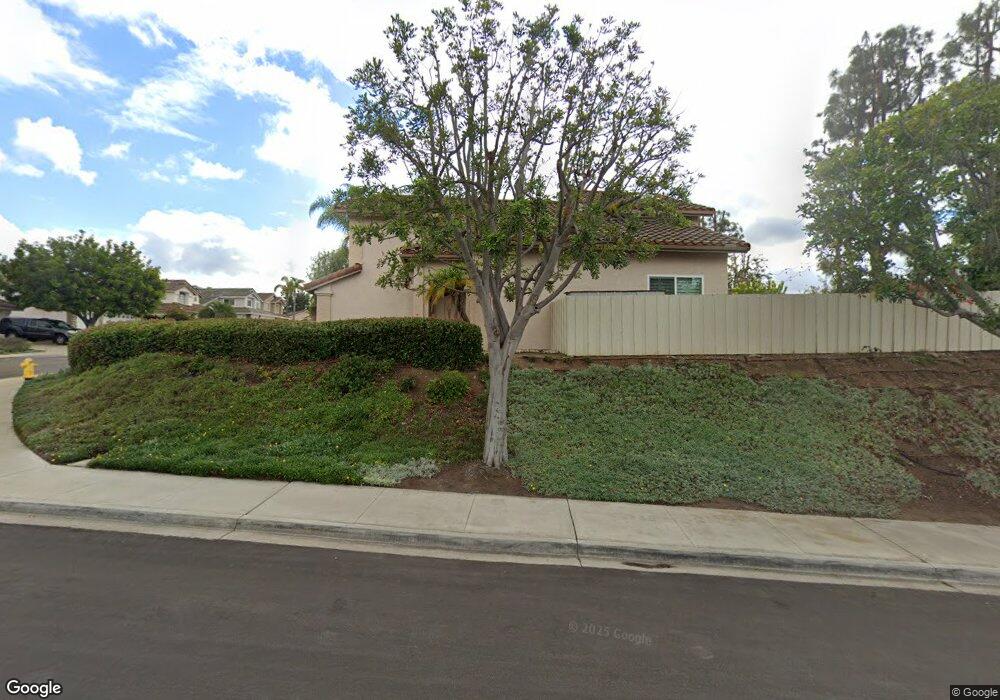
8859 Pipestone Way San Diego, CA 92129
Rancho Peñasquitos NeighborhoodEstimated Value: $1,304,132 - $1,534,000
4
Beds
3
Baths
1,848
Sq Ft
$762/Sq Ft
Est. Value
About This Home
This home is located at 8859 Pipestone Way, San Diego, CA 92129 and is currently estimated at $1,408,783, approximately $762 per square foot. 8859 Pipestone Way is a home located in San Diego County with nearby schools including Deer Canyon Elementary School, Mesa Verde Middle School, and Westview High School.
Ownership History
Date
Name
Owned For
Owner Type
Purchase Details
Closed on
Nov 3, 2006
Sold by
Ayers Richard L and Ayers Nancy V
Bought by
Ayers Richard and Ayers Nancy
Current Estimated Value
Purchase Details
Closed on
Mar 17, 1997
Sold by
Hanners Rodney B and Hanners Eileen A
Bought by
Ayers Richard L and Ayers Nancy
Home Financials for this Owner
Home Financials are based on the most recent Mortgage that was taken out on this home.
Original Mortgage
$172,800
Outstanding Balance
$21,178
Interest Rate
7.86%
Estimated Equity
$1,387,605
Purchase Details
Closed on
Mar 8, 1994
Sold by
Wojtczak Henry A and Wojtczak Ann C
Bought by
Hanners Rodney B and Hanners Eileen A
Home Financials for this Owner
Home Financials are based on the most recent Mortgage that was taken out on this home.
Original Mortgage
$184,000
Interest Rate
7.59%
Mortgage Type
VA
Purchase Details
Closed on
Sep 23, 1988
Create a Home Valuation Report for This Property
The Home Valuation Report is an in-depth analysis detailing your home's value as well as a comparison with similar homes in the area
Home Values in the Area
Average Home Value in this Area
Purchase History
| Date | Buyer | Sale Price | Title Company |
|---|---|---|---|
| Ayers Richard | -- | None Available | |
| Ayers Richard L | $216,000 | Continental Lawyers Title Co | |
| Hanners Rodney B | $212,000 | Continental Lawyers Title Co | |
| -- | $188,600 | -- |
Source: Public Records
Mortgage History
| Date | Status | Borrower | Loan Amount |
|---|---|---|---|
| Open | Ayers Richard L | $172,800 | |
| Previous Owner | Hanners Rodney B | $184,000 |
Source: Public Records
Tax History Compared to Growth
Tax History
| Year | Tax Paid | Tax Assessment Tax Assessment Total Assessment is a certain percentage of the fair market value that is determined by local assessors to be the total taxable value of land and additions on the property. | Land | Improvement |
|---|---|---|---|---|
| 2025 | $3,538 | $351,764 | $110,722 | $241,042 |
| 2024 | $3,538 | $344,867 | $108,551 | $236,316 |
| 2023 | $3,456 | $338,106 | $106,423 | $231,683 |
| 2022 | $3,389 | $331,478 | $104,337 | $227,141 |
| 2021 | $3,322 | $324,980 | $102,292 | $222,688 |
| 2020 | $3,293 | $321,649 | $101,244 | $220,405 |
| 2019 | $3,230 | $315,343 | $99,259 | $216,084 |
| 2018 | $3,162 | $309,161 | $97,313 | $211,848 |
| 2017 | $3,097 | $303,100 | $95,405 | $207,695 |
| 2016 | $3,025 | $297,158 | $93,535 | $203,623 |
| 2015 | $2,979 | $292,696 | $92,131 | $200,565 |
| 2014 | $2,908 | $286,964 | $90,327 | $196,637 |
Source: Public Records
Map
Nearby Homes
- 8985 Talca Ct
- 8465 Hovenweep Ct
- 14420 Meadowrun St
- 8316 Entreken Way Unit 1
- 13146 Thunderhead St
- 13170 Entreken Ave
- 8183 Doug Hill
- 7855 Via Belfiore Unit 1
- 8754 Park Run Rd
- 9858 Via Caceres
- 13856 Paseo Cardiel
- 13202 Salmon River Rd Unit 101
- 8672 Creekwood Ln
- 9118 Pimpernel Dr
- 13837 Paseo Cardiel
- 9531 Bayamon Rd
- 9462 Pipilo St
- 9525 High Park Ln
- 8114 Sendero de La Pradera
- 12573 Brickellia St
- 8867 Pipestone Way
- 13945 Gunnison Ct
- 13933 Gunnison Ct Unit 1
- 8873 Pipestone Way
- 8862 Pipestone Way
- 13925 Gunnison Ct
- 8866 Pipestone Way
- 8842 Pipestone Way
- 8858 Pipestone Way Unit 1
- 8877 Pipestone Way
- 8838 Pipestone Way Unit 1
- 8870 Pipestone Way
- 8834 Pipestone Way
- 8848 Pipestone Way
- 8850 Pipestone Way
- 13919 Gunnison Ct
- 8876 Pipestone Way Unit 1
- 8881 Pipestone Way
- 8830 Pipestone Way
- 8878 Pipestone Way