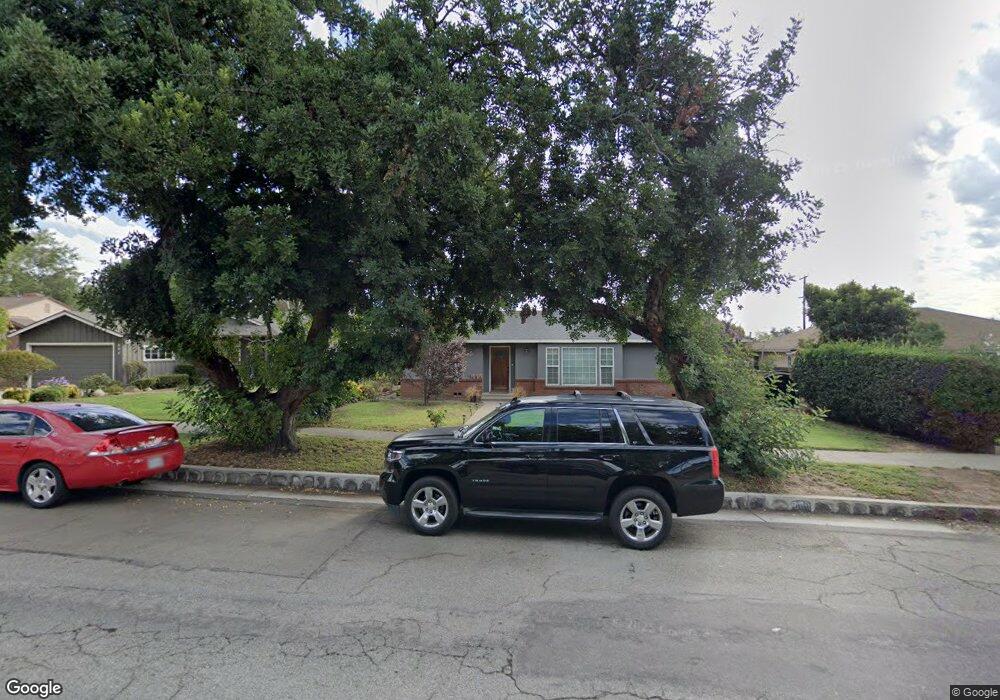
886 N 2nd Ave Upland, CA 91786
Estimated Value: $746,000 - $854,000
2
Beds
3
Baths
2,100
Sq Ft
$372/Sq Ft
Est. Value
About This Home
This home is located at 886 N 2nd Ave, Upland, CA 91786 and is currently estimated at $781,636, approximately $372 per square foot. 886 N 2nd Ave is a home located in San Bernardino County with nearby schools including Upland Elementary School, Upland Junior High School, and Upland High School.
Ownership History
Date
Name
Owned For
Owner Type
Purchase Details
Closed on
Mar 26, 2014
Sold by
May Neal B
Bought by
May Neal B and May Monica R
Current Estimated Value
Home Financials for this Owner
Home Financials are based on the most recent Mortgage that was taken out on this home.
Original Mortgage
$288,000
Outstanding Balance
$219,016
Interest Rate
4.35%
Mortgage Type
New Conventional
Estimated Equity
$562,620
Purchase Details
Closed on
Sep 11, 2009
Sold by
May Neal B
Bought by
The Neal B May Living Trust
Purchase Details
Closed on
Mar 29, 2007
Sold by
May Lorena C
Bought by
May Neal B
Purchase Details
Closed on
Nov 2, 1998
Sold by
May Lorena C
Bought by
May Lorena C and May Neal B
Purchase Details
Closed on
Jul 29, 1997
Sold by
May Neal B
Bought by
May Lorena C
Purchase Details
Closed on
May 2, 1994
Sold by
Burns Beggs Alicia
Bought by
May Neal B
Home Financials for this Owner
Home Financials are based on the most recent Mortgage that was taken out on this home.
Original Mortgage
$138,037
Interest Rate
8.56%
Mortgage Type
FHA
Create a Home Valuation Report for This Property
The Home Valuation Report is an in-depth analysis detailing your home's value as well as a comparison with similar homes in the area
Home Values in the Area
Average Home Value in this Area
Purchase History
| Date | Buyer | Sale Price | Title Company |
|---|---|---|---|
| May Neal B | -- | Fidelity Title Long Beach | |
| The Neal B May Living Trust | -- | None Available | |
| May Neal B | -- | None Available | |
| May Lorena C | -- | -- | |
| May Lorena C | -- | -- | |
| May Neal B | $140,000 | Commonwealth Land Title |
Source: Public Records
Mortgage History
| Date | Status | Borrower | Loan Amount |
|---|---|---|---|
| Open | May Neal B | $288,000 | |
| Previous Owner | May Neal B | $138,037 |
Source: Public Records
Tax History
| Year | Tax Paid | Tax Assessment Tax Assessment Total Assessment is a certain percentage of the fair market value that is determined by local assessors to be the total taxable value of land and additions on the property. | Land | Improvement |
|---|---|---|---|---|
| 2025 | $3,141 | $273,469 | $76,485 | $196,984 |
| 2024 | $3,042 | $268,107 | $74,985 | $193,122 |
| 2023 | $2,995 | $262,850 | $73,515 | $189,335 |
| 2022 | $2,930 | $257,697 | $72,074 | $185,623 |
| 2021 | $2,924 | $252,644 | $70,661 | $181,983 |
| 2020 | $2,845 | $250,053 | $69,936 | $180,117 |
| 2019 | $2,836 | $245,150 | $68,565 | $176,585 |
| 2018 | $2,769 | $240,344 | $67,221 | $173,123 |
| 2017 | $2,689 | $235,631 | $65,903 | $169,728 |
| 2016 | $2,176 | $201,011 | $64,611 | $136,400 |
| 2015 | $2,126 | $197,991 | $63,640 | $134,351 |
| 2014 | $2,072 | $194,112 | $62,393 | $131,719 |
Source: Public Records
Map
Nearby Homes
- 855 N Palm Ave
- 636 N Palm Ave
- 1270 N Euclid Ave
- 509 N Euclid Ave
- 910 N Redding Way Unit I
- 910 N Redding Way Unit F
- 1234 N Laurel Ave
- 769 Valadez St
- 511 D St
- 1318 N Laurel Ave
- 494 N Campus Ave
- 556 D St
- 478 N Campus Ave
- 1377 N 5th Ave
- 282 N 6th Ave
- 161 N 1st Ave
- 929 E Foothill Blvd Unit 91
- 929 E Foothill Blvd Unit 15
- 929 E Foothill Blvd Unit 46
- 929 E Foothill Blvd Unit 161
Your Personal Tour Guide
Ask me questions while you tour the home.