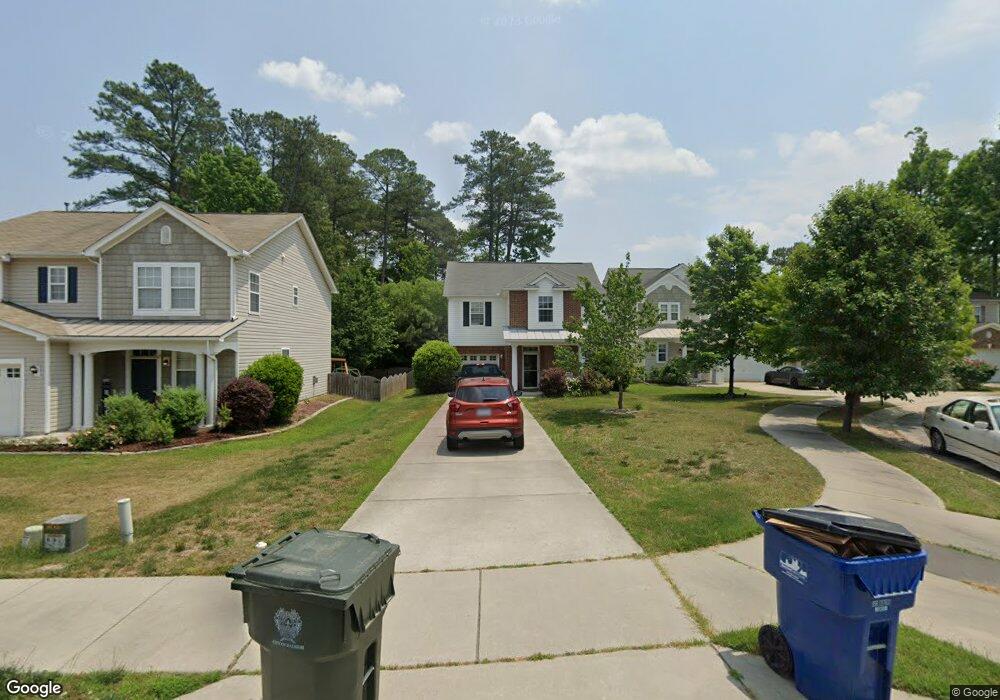
8867 Elizabeth Bennet Place Raleigh, NC 27616
Forestville NeighborhoodEstimated Value: $348,000 - $377,000
3
Beds
3
Baths
2,050
Sq Ft
$178/Sq Ft
Est. Value
About This Home
This home is located at 8867 Elizabeth Bennet Place, Raleigh, NC 27616 and is currently estimated at $364,122, approximately $177 per square foot. 8867 Elizabeth Bennet Place is a home located in Wake County with nearby schools including Wildwood Forest Elementary, East Millbrook Middle, and Wakefield High School.
Ownership History
Date
Name
Owned For
Owner Type
Purchase Details
Closed on
Jul 25, 2006
Sold by
Gunter Robert Scott and Gunter Michelle M
Bought by
Honcharuk Vyacheslav and Vuznytsya Olga
Current Estimated Value
Home Financials for this Owner
Home Financials are based on the most recent Mortgage that was taken out on this home.
Original Mortgage
$34,800
Interest Rate
6.28%
Mortgage Type
Stand Alone Second
Purchase Details
Closed on
Jan 31, 2005
Sold by
Kb Home Raleigh Durham Llc
Bought by
Gunter Robert Scott and Gunter Michelle M
Home Financials for this Owner
Home Financials are based on the most recent Mortgage that was taken out on this home.
Original Mortgage
$127,795
Interest Rate
6.95%
Mortgage Type
Fannie Mae Freddie Mac
Create a Home Valuation Report for This Property
The Home Valuation Report is an in-depth analysis detailing your home's value as well as a comparison with similar homes in the area
Home Values in the Area
Average Home Value in this Area
Purchase History
| Date | Buyer | Sale Price | Title Company |
|---|---|---|---|
| Honcharuk Vyacheslav | $174,000 | None Available | |
| Gunter Robert Scott | $160,000 | -- |
Source: Public Records
Mortgage History
| Date | Status | Borrower | Loan Amount |
|---|---|---|---|
| Closed | Honcharuk Vyacheslav | $34,800 | |
| Open | Honcharuk Vyacheslav | $139,200 | |
| Previous Owner | Gunter Robert Scott | $127,795 | |
| Closed | Gunter Robert Scott | $31,948 |
Source: Public Records
Tax History Compared to Growth
Tax History
| Year | Tax Paid | Tax Assessment Tax Assessment Total Assessment is a certain percentage of the fair market value that is determined by local assessors to be the total taxable value of land and additions on the property. | Land | Improvement |
|---|---|---|---|---|
| 2025 | $3,231 | $368,223 | $80,000 | $288,223 |
| 2024 | $3,218 | $368,223 | $80,000 | $288,223 |
| 2023 | $2,315 | $210,547 | $42,000 | $168,547 |
| 2022 | $2,152 | $210,547 | $42,000 | $168,547 |
| 2021 | $2,069 | $210,547 | $42,000 | $168,547 |
| 2020 | $2,031 | $210,547 | $42,000 | $168,547 |
| 2019 | $1,994 | $170,327 | $30,000 | $140,327 |
| 2018 | $1,881 | $170,327 | $30,000 | $140,327 |
| 2017 | $1,792 | $170,327 | $30,000 | $140,327 |
| 2016 | $1,755 | $170,327 | $30,000 | $140,327 |
| 2015 | $1,925 | $184,000 | $36,000 | $148,000 |
| 2014 | $1,827 | $184,000 | $36,000 | $148,000 |
Source: Public Records
Map
Nearby Homes
- 8911 Elizabeth Benneth Place
- 5126 Thornton Knoll Way
- 8857 Thornton Town Place
- 5163 Sandy Banks Rd
- 8947 Commons Townes Dr
- 8957 Commons Townes Dr
- 5107 Sandy Banks Rd
- 5121 Neuse Commons Ln
- 8885 Commons Townes Dr
- SYDNEY Plan at Thornton Townes
- JONATHAN Plan at Thornton Townes
- 8707 River Keeper Way
- 8640 Neuse Landing Ln Unit 110
- 8610 Neuse Landing Ln Unit 103
- 8620 Neuse Club Ln Unit 111
- 8620 Neuse Club Ln Unit 107
- 8702 Neuse Town Dr
- 5309 Neuse Wood Dr
- 8529 Beckett Chase Way
- 8537 Beckett Chase Way
- 8867 Elizabeth Bennett Place
- 8867 Elizabeth Bennet Piace
- 8871 Elizabeth Bennet Place
- 8859 Elizabeth Bennet Place
- 8859 Elizabeth Bennett Place
- 8875 Elizabeth Bennett Place
- 8875 Elizabeth Bennet Place
- 8855 Elizabeth Bennet Place
- 8855 Elizabeth Bennet Piace
- 8855 Elizabeth Bennett
- 8879 Elizabeth Bennett Place
- 8879 Elizabeth Bennet Place
- 8851 Elizabeth Bennet Place
- 8851 Elizabeth Bennett Place
- 8834 Thornton Garden Ln
- 8832 Thornton Garden Ln
- 8866 Elizabeth Bennet Place
- 8830 Thornton Garden Ln
- 8866 Elizabeth Bennett
- 8870 Elizabeth Bennet Place