Estimated Value: $504,923 - $757,000
6
Beds
3
Baths
2,271
Sq Ft
$284/Sq Ft
Est. Value
About This Home
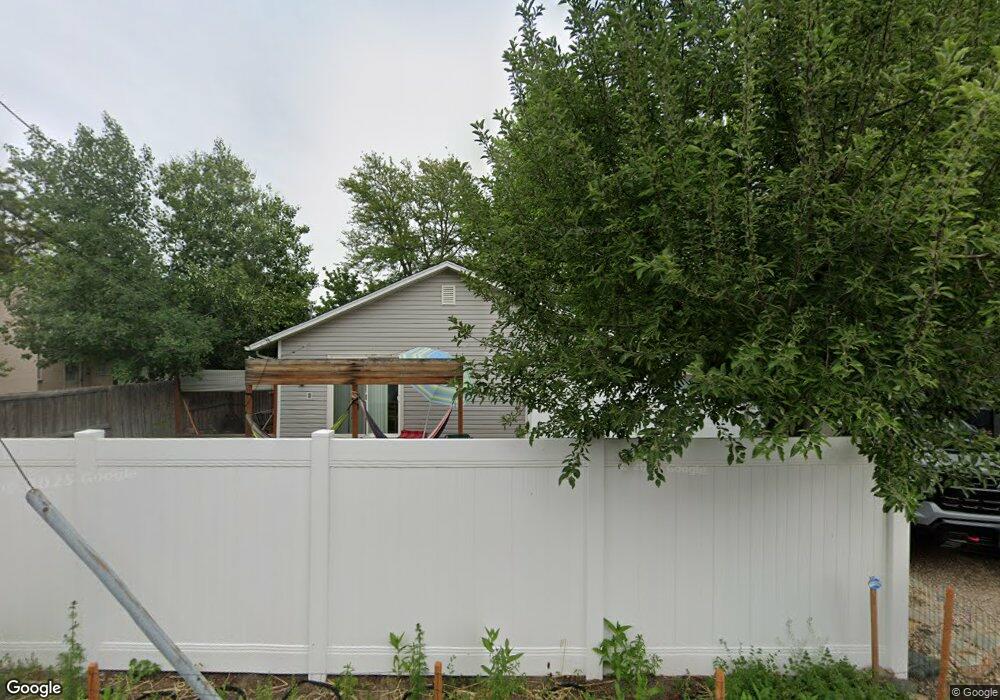
This home is located at 8869 S 630 E, Sandy, UT 84070 and is currently estimated at $645,731, approximately $284 per square foot. 8869 S 630 E is a home located in Salt Lake County with nearby schools including Sandy Elementary School, Mount Jordan Middle School, and Jordan High.
Ownership History
Date
Name
Owned For
Owner Type
Purchase Details
Closed on
Feb 10, 2021
Sold by
Townsend Spencer
Bought by
Sst 2 Holdings Llc
Current Estimated Value
Home Financials for this Owner
Home Financials are based on the most recent Mortgage that was taken out on this home.
Original Mortgage
$280,000
Outstanding Balance
$249,994
Interest Rate
2.6%
Mortgage Type
New Conventional
Estimated Equity
$395,737
Purchase Details
Closed on
Apr 19, 2016
Sold by
Townsend Spencer
Bought by
Sst 2 Holdings Llc
Create a Home Valuation Report for This Property
The Home Valuation Report is an in-depth analysis detailing your home's value as well as a comparison with similar homes in the area
Home Values in the Area
Average Home Value in this Area
Purchase History
| Date | Buyer | Sale Price | Title Company |
|---|---|---|---|
| Sst 2 Holdings Llc | -- | Accommodation | |
| Townsend Spencer | -- | Charger Title Insurance Agcy | |
| Sst 2 Holdings Llc | -- | Charger Title Insurance Agcy |
Source: Public Records
Mortgage History
| Date | Status | Borrower | Loan Amount |
|---|---|---|---|
| Open | Townsend Spencer | $280,000 |
Source: Public Records
Tax History
| Year | Tax Paid | Tax Assessment Tax Assessment Total Assessment is a certain percentage of the fair market value that is determined by local assessors to be the total taxable value of land and additions on the property. | Land | Improvement |
|---|---|---|---|---|
| 2025 | $2,678 | $551,500 | $133,800 | $417,700 |
| 2024 | $2,678 | $495,200 | $122,800 | $372,400 |
| 2023 | $2,403 | $443,100 | $116,700 | $326,400 |
| 2022 | $2,570 | $463,000 | $114,400 | $348,600 |
| 2021 | $2,477 | $379,800 | $89,600 | $290,200 |
| 2020 | $2,320 | $335,500 | $89,600 | $245,900 |
| 2019 | $2,163 | $304,800 | $89,600 | $215,200 |
| 2016 | $1,529 | $207,100 | $64,500 | $142,600 |
Source: Public Records
Map
Nearby Homes
- 8915 S 660 E Unit 103
- 8732 S 620 E
- 8797 Green Way Unit 3
- 8729 S Leafwood Ln
- 8732 S Oakwood Park Cr
- 8722 S Oakwood Park Cir
- 627 E 8680 S
- 807 E Whisper Cove Rd
- 412 E 8760 S
- 9092 Enchanted Oak Ln
- 9217 S Holiday Bowl Ct
- 635 Pioneer Ave
- 487 E 9270 S
- 362 E 9150 S
- 270 E 8680 S
- 744 E 8425 S
- 8390 S 745 E
- 9203 S 220 E
- 8459 S 300 E
- 8558 S Center St
Your Personal Tour Guide
Ask me questions while you tour the home.