Estimated Value: $376,000 - $439,000
3
Beds
1
Bath
1,118
Sq Ft
$372/Sq Ft
Est. Value
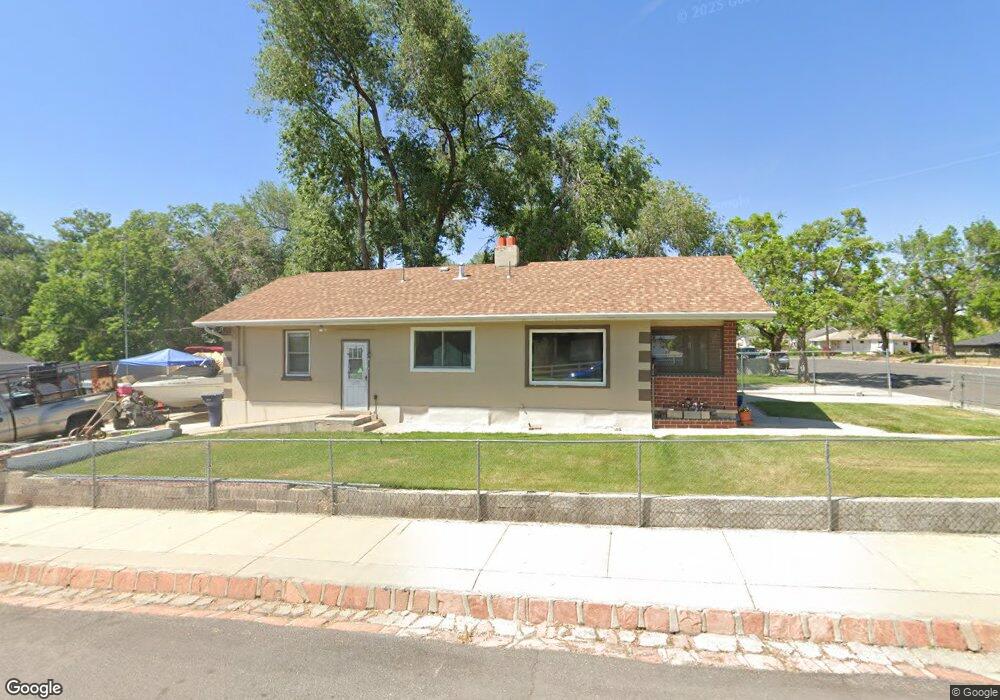
About This Home
This home is located at 8870 S 60 E, Sandy, UT 84070 and is currently estimated at $415,584, approximately $371 per square foot. 8870 S 60 E is a home located in Salt Lake County with nearby schools including Sandy Elementary School, Mount Jordan Middle School, and Jordan High.
Ownership History
Date
Name
Owned For
Owner Type
Purchase Details
Closed on
Oct 21, 2021
Sold by
Hendricks Sheryl
Bought by
Hendricks Sheryl and Vailea Kamie Lynn
Current Estimated Value
Purchase Details
Closed on
May 11, 2005
Sold by
Parra Antonio and Hendricks Sheryl
Bought by
Hendricks Sheryl
Purchase Details
Closed on
Apr 4, 1997
Sold by
Parra Antonio
Bought by
Parra Antonio and Hendricks Sheryl
Home Financials for this Owner
Home Financials are based on the most recent Mortgage that was taken out on this home.
Original Mortgage
$39,000
Interest Rate
7.19%
Purchase Details
Closed on
Mar 19, 1988
Sold by
Butler Glenda A
Bought by
Parra Jose and Parra Angelita
Create a Home Valuation Report for This Property
The Home Valuation Report is an in-depth analysis detailing your home's value as well as a comparison with similar homes in the area
Home Values in the Area
Average Home Value in this Area
Purchase History
| Date | Buyer | Sale Price | Title Company |
|---|---|---|---|
| Hendricks Sheryl | -- | Accommodation | |
| Hendricks Sheryl | -- | -- | |
| Hendricks Sheryl | -- | None Available | |
| Parra Antonio | -- | -- | |
| Parra Jose | -- | -- |
Source: Public Records
Mortgage History
| Date | Status | Borrower | Loan Amount |
|---|---|---|---|
| Closed | Parra Antonio | $39,000 |
Source: Public Records
Tax History
| Year | Tax Paid | Tax Assessment Tax Assessment Total Assessment is a certain percentage of the fair market value that is determined by local assessors to be the total taxable value of land and additions on the property. | Land | Improvement |
|---|---|---|---|---|
| 2025 | $1,937 | $428,500 | $101,400 | $327,100 |
| 2024 | $1,937 | $379,200 | $93,000 | $286,200 |
| 2023 | -- | $341,300 | $88,400 | $252,900 |
| 2022 | $0 | $355,900 | $86,700 | $269,200 |
| 2021 | $938 | $288,600 | $67,900 | $220,700 |
| 2020 | $808 | $254,600 | $67,900 | $186,700 |
| 2019 | $750 | $232,300 | $67,900 | $164,400 |
| 2016 | $564 | $173,700 | $48,900 | $124,800 |
Source: Public Records
Map
Nearby Homes
- 8558 S Center St
- 112 E 8680 S
- 87 W 8710 S
- 140 W 8710 S
- 8812 S Stratford Cir
- 270 E 8680 S
- 37 Crawford Place
- 87 Pioneer Ave
- 220 E Pioneer Ave
- 149 E Pioneer Ave
- 194 Pioneer Ave
- 8470 Solar Way
- 412 E 8760 S
- 362 E 9150 S
- 227 E St Germain Way
- 8459 S 300 E
- 36 E Opequon Rd
- 132 E Chambord Ct
- 136 E Chambord Ct
- 138 E Chambord Ct
Your Personal Tour Guide
Ask me questions while you tour the home.