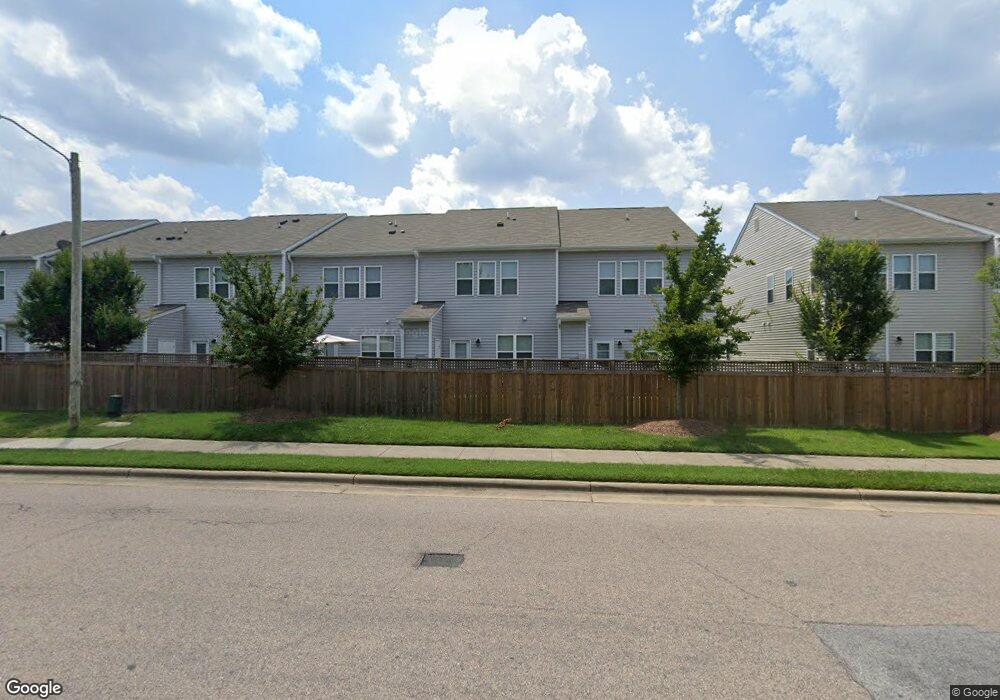
8876 Commons Townes Dr Unit 46 Raleigh, NC 27616
Forestville NeighborhoodEstimated Value: $305,000 - $314,000
3
Beds
3
Baths
1,647
Sq Ft
$187/Sq Ft
Est. Value
About This Home
This home is located at 8876 Commons Townes Dr Unit 46, Raleigh, NC 27616 and is currently estimated at $308,580, approximately $187 per square foot. 8876 Commons Townes Dr Unit 46 is a home located in Wake County with nearby schools including Wildwood Forest Elementary, East Millbrook Middle, and Wakefield High School.
Ownership History
Date
Name
Owned For
Owner Type
Purchase Details
Closed on
Jun 29, 2023
Sold by
Bryant Chelsea and Bryant Matthew
Bought by
Murphy Devin K and Murphy Melissa A
Current Estimated Value
Home Financials for this Owner
Home Financials are based on the most recent Mortgage that was taken out on this home.
Original Mortgage
$275,000
Outstanding Balance
$267,938
Interest Rate
6.39%
Mortgage Type
New Conventional
Estimated Equity
$40,642
Purchase Details
Closed on
Apr 8, 2022
Sold by
Kariuki Francis M
Bought by
Kariuki Francis M
Purchase Details
Closed on
Dec 19, 2017
Sold by
Terramor Homes Inc
Bought by
Thompson Chelsea
Home Financials for this Owner
Home Financials are based on the most recent Mortgage that was taken out on this home.
Original Mortgage
$1,979,990
Interest Rate
4.62%
Mortgage Type
Adjustable Rate Mortgage/ARM
Create a Home Valuation Report for This Property
The Home Valuation Report is an in-depth analysis detailing your home's value as well as a comparison with similar homes in the area
Home Values in the Area
Average Home Value in this Area
Purchase History
| Date | Buyer | Sale Price | Title Company |
|---|---|---|---|
| Murphy Devin K | $325,000 | None Listed On Document | |
| Murphy Devin K | $325,000 | None Listed On Document | |
| Kariuki Francis M | -- | None Listed On Document | |
| Thompson Chelsea | $196,000 | None Available |
Source: Public Records
Mortgage History
| Date | Status | Borrower | Loan Amount |
|---|---|---|---|
| Open | Murphy Devin K | $275,000 | |
| Closed | Murphy Devin K | $50,000 | |
| Closed | Murphy Devin K | $275,000 | |
| Previous Owner | Thompson Chelsea | $1,979,990 |
Source: Public Records
Tax History Compared to Growth
Tax History
| Year | Tax Paid | Tax Assessment Tax Assessment Total Assessment is a certain percentage of the fair market value that is determined by local assessors to be the total taxable value of land and additions on the property. | Land | Improvement |
|---|---|---|---|---|
| 2025 | $2,881 | $328,110 | $65,000 | $263,110 |
| 2024 | $2,870 | $328,110 | $65,000 | $263,110 |
| 2023 | $2,591 | $235,916 | $40,000 | $195,916 |
| 2022 | $2,409 | $235,916 | $40,000 | $195,916 |
| 2021 | $2,315 | $235,916 | $40,000 | $195,916 |
| 2020 | $2,273 | $235,916 | $40,000 | $195,916 |
| 2019 | $2,250 | $192,388 | $35,000 | $157,388 |
| 2018 | $2,122 | $35,000 | $35,000 | $0 |
| 2017 | $364 | $35,000 | $35,000 | $0 |
Source: Public Records
Map
Nearby Homes
- 8885 Commons Townes Dr
- 8957 Commons Townes Dr
- 8947 Commons Townes Dr
- 8857 Thornton Town Place
- 5107 Sandy Banks Rd
- 8707 River Keeper Way
- 5126 Thornton Knoll Way
- 5163 Sandy Banks Rd
- 5121 Neuse Commons Ln
- 8911 Elizabeth Benneth Place
- 8620 Neuse Club Ln Unit 107
- 4821 Gossamer Ln Unit 103
- 4821 Gossamer Ln Unit 102
- 8640 Neuse Landing Ln Unit 110
- 4801 Gossamer Ln Unit 106
- 4820 Gossamer Ln Unit 101 & 102
- 4810 Gossamer Ln Unit 105
- 8611 Brushfoot Way Unit 107
- 5309 Neuse Wood Dr
- 8019 Satillo Ln
- 8876 Commons Townes Dr
- 8874 Commons Townes Dr Unit 47
- 8878 Commons Townes Dr
- 8878 Commons Townes Dr Unit 45
- 8872 Commons Townes Dr
- 8872 Commons Townes Dr Unit 48
- 8884 Commons Townes Dr
- 8870 Commons Townes Dr Unit 49
- 8886 Commons Townes Dr Unit 43
- 8868 Commons Townes Dr Unit 50
- 8888 Commons Townes Dr
- 8890 Commons Townes Dr Unit 41
- 8866 Commons Townes Dr Unit 51
- 8866 Commons Townes Dr
- 8881 Commons Townes Dr Unit 93
- 8875 Commons Townes Dr
- 8873 Commons Townes Dr Unit 91
- 8873 Commons Townes Dr
- 8883 Commons Townes Dr Unit 94
- 8871 Commons Townes Dr Unit 90