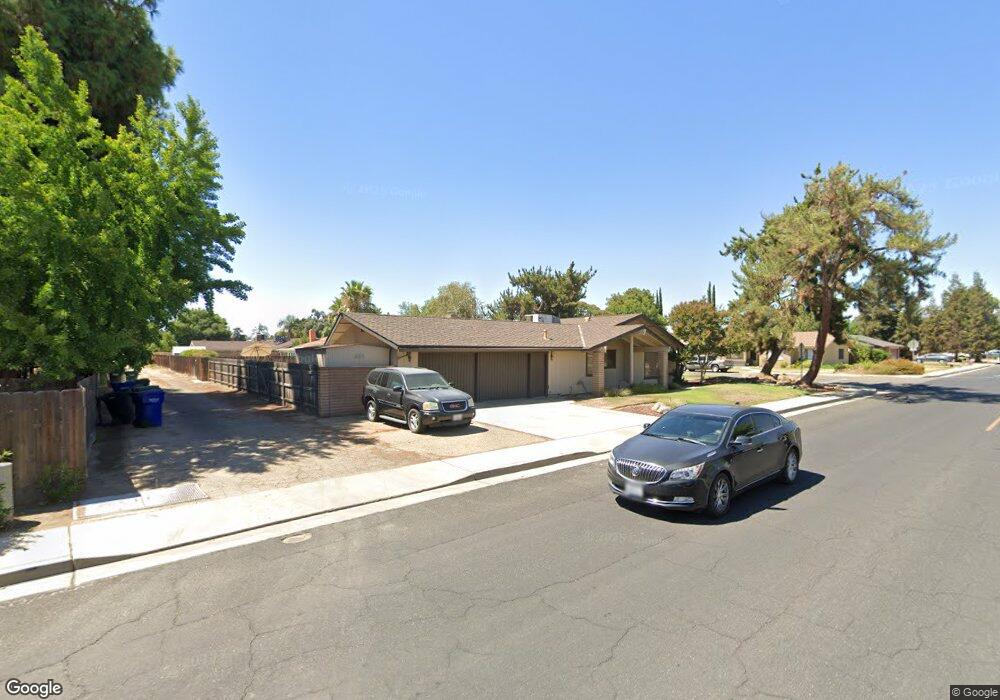
888 E Sequoia Dr Dinuba, CA 93618
Estimated Value: $408,000 - $496,000
4
Beds
3
Baths
2,379
Sq Ft
$191/Sq Ft
Est. Value
About This Home
This home is located at 888 E Sequoia Dr, Dinuba, CA 93618 and is currently estimated at $453,811, approximately $190 per square foot. 888 E Sequoia Dr is a home located in Tulare County with nearby schools including Lincoln Elementary School, Washington Intermediate School, and Dinuba High School.
Ownership History
Date
Name
Owned For
Owner Type
Purchase Details
Closed on
Jan 18, 2019
Sold by
Fannie Mae
Bought by
Godinez Frank
Current Estimated Value
Home Financials for this Owner
Home Financials are based on the most recent Mortgage that was taken out on this home.
Original Mortgage
$270,750
Outstanding Balance
$237,068
Interest Rate
4.4%
Mortgage Type
New Conventional
Estimated Equity
$216,743
Purchase Details
Closed on
Jun 8, 2018
Sold by
Brady Ronald A
Bought by
Federal National Mortgage Association and Fannie Mae
Purchase Details
Closed on
Jan 23, 2012
Sold by
Brady Ronald A
Bought by
Alferd Todd and Alferd Shona
Purchase Details
Closed on
Dec 18, 2002
Sold by
Brady Ethelene M
Bought by
Brady Ronald A
Home Financials for this Owner
Home Financials are based on the most recent Mortgage that was taken out on this home.
Original Mortgage
$166,500
Interest Rate
5.96%
Create a Home Valuation Report for This Property
The Home Valuation Report is an in-depth analysis detailing your home's value as well as a comparison with similar homes in the area
Home Values in the Area
Average Home Value in this Area
Purchase History
| Date | Buyer | Sale Price | Title Company |
|---|---|---|---|
| Godinez Frank | $285,000 | Stewart Title Of California | |
| Federal National Mortgage Association | $247,334 | Title365 | |
| Alferd Todd | -- | None Available | |
| Brady Ronald A | -- | Chicago Title Co |
Source: Public Records
Mortgage History
| Date | Status | Borrower | Loan Amount |
|---|---|---|---|
| Open | Godinez Frank | $270,750 | |
| Previous Owner | Brady Ronald A | $166,500 |
Source: Public Records
Tax History
| Year | Tax Paid | Tax Assessment Tax Assessment Total Assessment is a certain percentage of the fair market value that is determined by local assessors to be the total taxable value of land and additions on the property. | Land | Improvement |
|---|---|---|---|---|
| 2025 | $3,475 | $317,922 | $50,199 | $267,723 |
| 2024 | $3,475 | $311,689 | $49,215 | $262,474 |
| 2023 | $3,432 | $305,578 | $48,250 | $257,328 |
| 2022 | $3,278 | $299,587 | $47,304 | $252,283 |
| 2021 | $3,191 | $293,712 | $46,376 | $247,336 |
| 2020 | $3,258 | $290,700 | $45,900 | $244,800 |
| 2019 | $3,181 | $275,400 | $45,900 | $229,500 |
| 2018 | $1,922 | $168,205 | $14,905 | $153,300 |
| 2017 | $1,915 | $164,907 | $14,613 | $150,294 |
| 2016 | $1,824 | $161,673 | $14,326 | $147,347 |
| 2015 | $1,738 | $159,245 | $14,111 | $145,134 |
| 2014 | $1,738 | $156,126 | $13,835 | $142,291 |
Source: Public Records
Map
Nearby Homes
- 0 E Sequoia Dr
- 800 N Whitney Ave
- 1185 E Ramblewood Dr
- 0 N Hayes Ave
- 1237 Chestnut Ln
- 683 N Villa Ave
- 337 Village Dr
- 1755 W Rosemary Ave Unit Mb65
- 1755 W Rosemary Ave
- 1723 W Rosemary Ave
- 581 N Crawford Ave Unit 41
- 581 N Crawford Ave Unit 94
- 581 N 581 N Crawford Ave Unit 2
- 277 N H St
- 1847 E Lauren Ave
- 201 Bryan Ave
- 1702 Bolinger Way
- 1708 Bolinger Way
- 223 Bryan Ave
- 224 Bryan Ave
- 888 E Sequoia Dr
- 888 E Sequoia Dr
- 888 E Sequoia Dr
- 868 E Sequoia Dr
- 236 E Sequoia Dr
- 889 E Millwood Dr
- 865 E Millwood Dr
- 1068 N Newton Dr
- 889 E Sequoia Dr
- 832 E Sequoia Dr
- 843 E Millwood Dr
- 1202 N Mckinley Ct
- 1200 N Newton Dr
- 901 E Millwood Dr
- 954 E Sequoia Dr
- 1213 N Newton Dr
- 1210 N Newton Dr
- 790 E Sequoia Dr
- 1214 N Mckinley Ct
- 925 E Millwood Dr
Your Personal Tour Guide
Ask me questions while you tour the home.