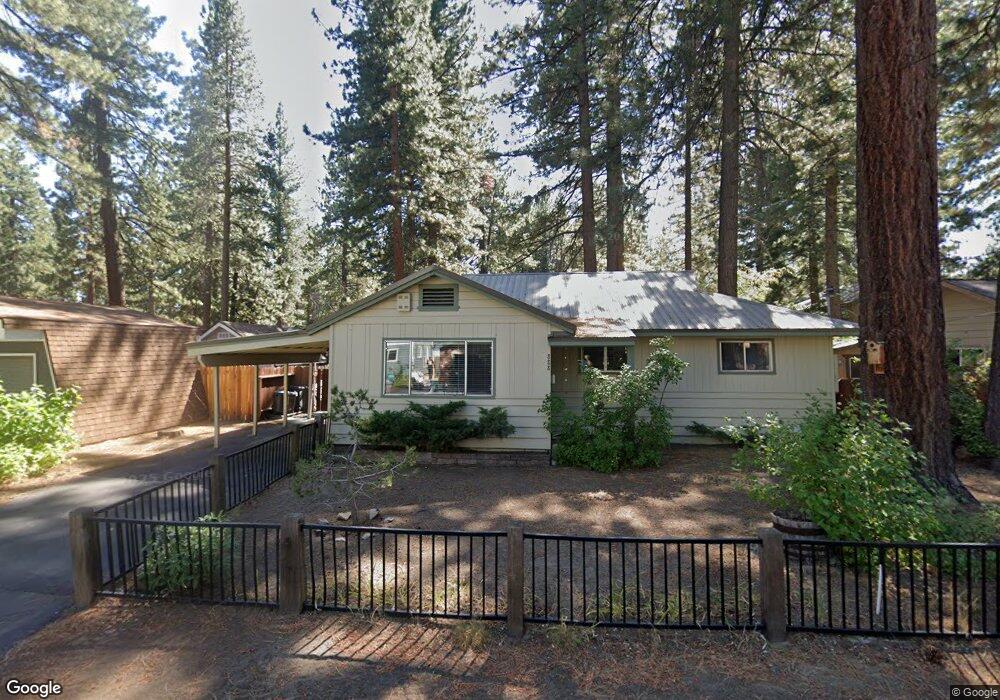
888 Lapham Dr South Lake Tahoe, CA 96150
Estimated Value: $585,695 - $698,000
3
Beds
2
Baths
1,338
Sq Ft
$475/Sq Ft
Est. Value
About This Home
This home is located at 888 Lapham Dr, South Lake Tahoe, CA 96150 and is currently estimated at $634,924, approximately $474 per square foot. 888 Lapham Dr is a home located in El Dorado County with nearby schools including Tahoe Valley Elementary School, South Tahoe Middle School, and South Tahoe High School.
Ownership History
Date
Name
Owned For
Owner Type
Purchase Details
Closed on
Mar 20, 2019
Sold by
Wieser Tahnie A
Bought by
Wieser Tahnie A and Tahnie A Wieser Revocable Trus
Current Estimated Value
Purchase Details
Closed on
Dec 21, 2005
Sold by
Hilling Artur and Hilling Margaret
Bought by
Campbell Julie
Purchase Details
Closed on
Sep 15, 2000
Sold by
Hilling Artur and Campbell Julie
Bought by
Hilling Artur and Hilling Margaret
Home Financials for this Owner
Home Financials are based on the most recent Mortgage that was taken out on this home.
Original Mortgage
$80,000
Interest Rate
8.16%
Purchase Details
Closed on
Aug 8, 2000
Sold by
Hilling Margaret
Bought by
Hilling Artur
Home Financials for this Owner
Home Financials are based on the most recent Mortgage that was taken out on this home.
Original Mortgage
$80,000
Interest Rate
8.16%
Create a Home Valuation Report for This Property
The Home Valuation Report is an in-depth analysis detailing your home's value as well as a comparison with similar homes in the area
Home Values in the Area
Average Home Value in this Area
Purchase History
| Date | Buyer | Sale Price | Title Company |
|---|---|---|---|
| Wieser Tahnie A | -- | None Available | |
| Campbell Julie | -- | None Available | |
| Hilling Artur | -- | First American Title Ins Co | |
| Hilling Artur | -- | First American Title Ins Co | |
| Hilling Arthur | $171,000 | First American Title Ins Co |
Source: Public Records
Mortgage History
| Date | Status | Borrower | Loan Amount |
|---|---|---|---|
| Previous Owner | Hilling Arthur | $80,000 |
Source: Public Records
Tax History Compared to Growth
Tax History
| Year | Tax Paid | Tax Assessment Tax Assessment Total Assessment is a certain percentage of the fair market value that is determined by local assessors to be the total taxable value of land and additions on the property. | Land | Improvement |
|---|---|---|---|---|
| 2025 | $2,698 | $257,636 | $97,928 | $159,708 |
| 2024 | $2,698 | $252,585 | $96,008 | $156,577 |
| 2023 | $2,650 | $247,633 | $94,126 | $153,507 |
| 2022 | $2,623 | $242,779 | $92,281 | $150,498 |
| 2021 | $2,581 | $238,020 | $90,472 | $147,548 |
| 2020 | $2,544 | $235,581 | $89,545 | $146,036 |
| 2019 | $2,530 | $230,963 | $87,790 | $143,173 |
| 2018 | $2,473 | $226,435 | $86,069 | $140,366 |
| 2017 | $2,433 | $221,996 | $84,382 | $137,614 |
| 2016 | $2,383 | $217,644 | $82,728 | $134,916 |
| 2015 | $2,356 | $214,378 | $81,487 | $132,891 |
| 2014 | $2,260 | $210,181 | $79,892 | $130,289 |
Source: Public Records
Map
Nearby Homes
- 914 Tahoe Island Dr
- 2007 5th St Unit E
- 2007 5th St Unit A
- 2007 5th St Unit F
- 776 Patricia Ln
- 2246 Idaho Ave
- 867 Clement St
- 1890 10th St
- 1124 Tata Ln
- 741 Tahoe Island Dr
- 921 Gardner St
- 2191 Butler Ave
- 673 James Ave
- 724 Tahoe Island Dr
- 2298 Idaho Ave
- 2165 Jean Ave
- 2244 Texas Ave
- 760 Clement St
- 2293 Eloise Ave Unit D
- 2028 13th St
- 882 Lapham Dr
- 894 Lapham Dr
- 893 Patricia Ln
- 889 Patricia Ln
- 889 Lapham Dr
- 874 Lapham Dr
- 897 Patricia Ln
- 898 Lapham Dr
- 883 Lapham Dr
- 895 Lapham Dr
- 883 Patricia Ln
- 877 Patricia Ln
- 872 Lapham Dr
- 904 Lapham Dr
- 900 Secret Harbor Dr
- 888 Secret Harbor Dr
- 884 Secret Harbor Dr
- 894 Secret Harbor Dr
- 905 Lapham Dr
- 875 Patricia Ln