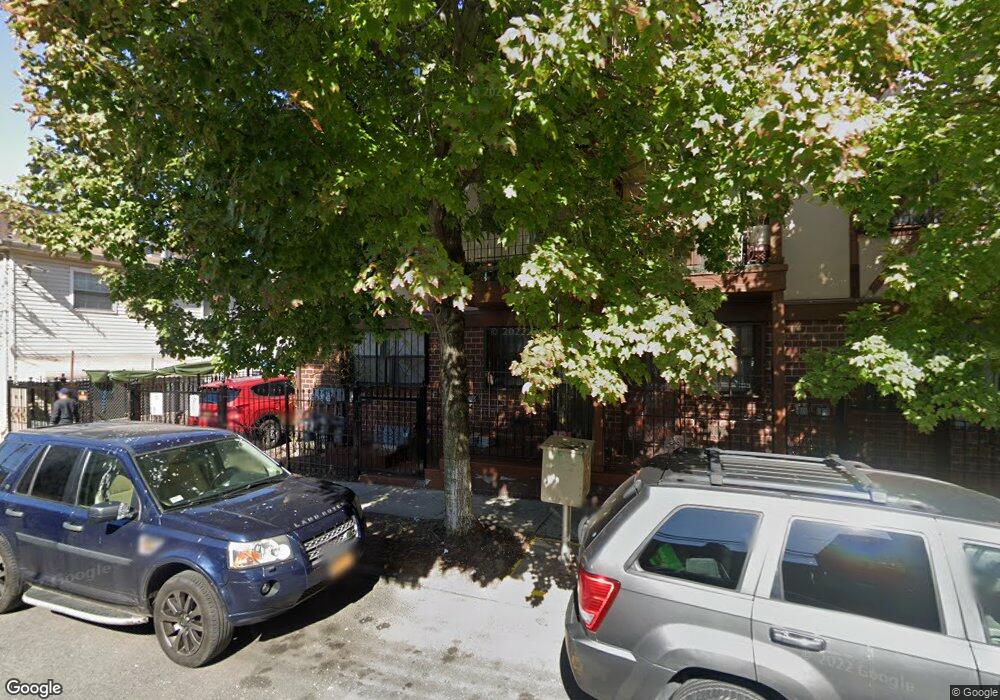
888 Union Ave Unit C Bronx, NY 10459
Morrisania NeighborhoodEstimated Value: $336,593 - $491,000
--
Bed
--
Bath
1,090
Sq Ft
$367/Sq Ft
Est. Value
About This Home
This home is located at 888 Union Ave Unit C, Bronx, NY 10459 and is currently estimated at $399,648, approximately $366 per square foot. 888 Union Ave Unit C is a home located in Bronx County with nearby schools including P.S. 140 The Eagle School, Ms 301 Paul L Dunbar, and South Bronx Early College Academy Charter School.
Ownership History
Date
Name
Owned For
Owner Type
Purchase Details
Closed on
Sep 27, 2007
Sold by
Rivera Joshua
Bought by
Moven Kaseem
Current Estimated Value
Home Financials for this Owner
Home Financials are based on the most recent Mortgage that was taken out on this home.
Original Mortgage
$206,400
Outstanding Balance
$130,738
Interest Rate
6.49%
Mortgage Type
Purchase Money Mortgage
Estimated Equity
$268,910
Purchase Details
Closed on
Oct 11, 2002
Sold by
Rodriquez Manuel E and Rodriquez Amalia
Bought by
Rivera Joshua
Home Financials for this Owner
Home Financials are based on the most recent Mortgage that was taken out on this home.
Original Mortgage
$92,000
Interest Rate
6.03%
Purchase Details
Closed on
Jul 19, 1995
Sold by
South Bronx Churches Sponsoring Committe
Bought by
Rodriguez Manuel E and Rodriguez Amalla
Home Financials for this Owner
Home Financials are based on the most recent Mortgage that was taken out on this home.
Original Mortgage
$72,000
Interest Rate
7.48%
Create a Home Valuation Report for This Property
The Home Valuation Report is an in-depth analysis detailing your home's value as well as a comparison with similar homes in the area
Home Values in the Area
Average Home Value in this Area
Purchase History
| Date | Buyer | Sale Price | Title Company |
|---|---|---|---|
| Moven Kaseem | $258,000 | -- | |
| Rivera Joshua | -- | -- | |
| Rodriguez Manuel E | $96,500 | -- |
Source: Public Records
Mortgage History
| Date | Status | Borrower | Loan Amount |
|---|---|---|---|
| Open | Moven Kaseem | $206,400 | |
| Previous Owner | Rivera Joshua | $92,000 | |
| Previous Owner | Rodriguez Manuel E | $72,000 | |
| Closed | Rodriguez Manuel E | $15,000 |
Source: Public Records
Tax History Compared to Growth
Tax History
| Year | Tax Paid | Tax Assessment Tax Assessment Total Assessment is a certain percentage of the fair market value that is determined by local assessors to be the total taxable value of land and additions on the property. | Land | Improvement |
|---|---|---|---|---|
| 2025 | $2,010 | $11,405 | $260 | $11,145 |
| 2024 | $2,010 | $11,405 | $310 | $11,095 |
| 2023 | $1,927 | $10,889 | $343 | $10,546 |
| 2022 | $1,764 | $17,590 | $596 | $16,994 |
| 2021 | $0 | $15,122 | $596 | $14,526 |
| 2020 | $1,716 | $14,439 | $596 | $13,843 |
| 2019 | $1,695 | $13,632 | $596 | $13,036 |
| 2018 | $1,552 | $9,074 | $389 | $8,685 |
| 2017 | $1,446 | $8,562 | $398 | $8,164 |
| 2016 | $1,305 | $8,078 | $382 | $7,696 |
| 2015 | $387 | $7,920 | $338 | $7,582 |
| 2014 | $387 | $7,920 | $338 | $7,582 |
Source: Public Records
Map
Nearby Homes
- 907 Prospect Ave Unit B
- 898 Union Ave Unit C
- 900 Union Ave Unit C
- 853 Macy Place Unit 3E
- 853 Macy Place Unit 4H
- 857 Macy Place
- 776 Hewitt Place
- 767 Union Ave
- 883 E 165th St Unit 3B
- 879 Cauldwell Ave
- 653 E 158th St
- 999 Kelly St
- 782 Cauldwell Ave
- 956 E 156th St
- 891 Tiffany St
- 814 Fox St
- 917 Fox St
- 1047 Trinity Ave
- 1100 Jackson Ave
- 1102 Jackson Ave
- 888 Union Ave Unit B
- 888 Union Ave Unit A
- 886 Union Ave Unit C
- 886 Union Ave Unit B
- 886 Union Ave Unit A
- 884 Union Ave Unit C
- 884 Union Ave Unit B
- 884 Union Ave Unit A
- 890 Union Ave Unit C
- 890 Union Ave Unit B
- 890 Union Ave Unit A
- 882 Union Ave Unit C
- 882 Union Ave Unit B
- 882 Union Ave Unit A
- 894 Union Ave Unit C
- 894 Union Ave Unit B
- 892 Union Ave Unit C
- 892 Union Ave Unit B
- 892 Union Ave Unit A
- 894 Union Ave