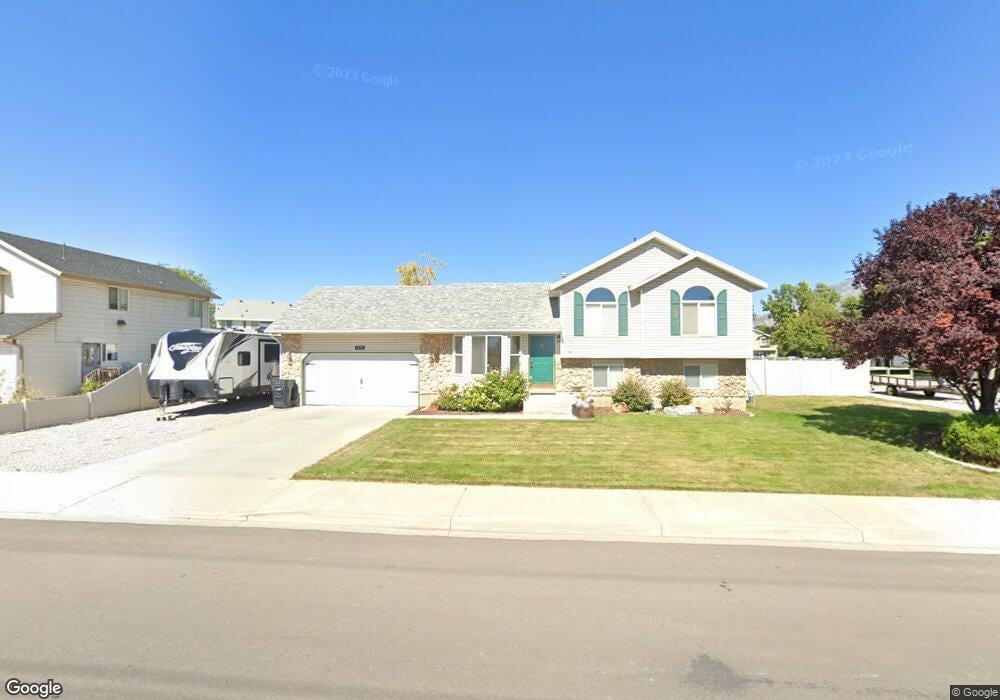
888 W 1560 S Provo, UT 84601
Franklin NeighborhoodEstimated Value: $462,000 - $480,000
4
Beds
2
Baths
1,640
Sq Ft
$288/Sq Ft
Est. Value
About This Home
This home is located at 888 W 1560 S, Provo, UT 84601 and is currently estimated at $472,270, approximately $287 per square foot. 888 W 1560 S is a home located in Utah County with nearby schools including Sunset View Elementary School, Dixon Middle School, and Provo High School.
Ownership History
Date
Name
Owned For
Owner Type
Purchase Details
Closed on
Apr 27, 2001
Sold by
Homolik Mathew Scott
Bought by
Allman Steven H
Current Estimated Value
Home Financials for this Owner
Home Financials are based on the most recent Mortgage that was taken out on this home.
Original Mortgage
$147,682
Outstanding Balance
$54,940
Interest Rate
6.98%
Mortgage Type
FHA
Estimated Equity
$417,330
Purchase Details
Closed on
May 6, 1996
Sold by
Nordhoff Gary and Hughes Gregory
Bought by
Homolik Mathew Scott
Home Financials for this Owner
Home Financials are based on the most recent Mortgage that was taken out on this home.
Original Mortgage
$118,750
Interest Rate
7.82%
Purchase Details
Closed on
Apr 30, 1996
Sold by
Kelson Wade
Bought by
Nordhoff Gary and Hughes Gregory
Home Financials for this Owner
Home Financials are based on the most recent Mortgage that was taken out on this home.
Original Mortgage
$118,750
Interest Rate
7.82%
Create a Home Valuation Report for This Property
The Home Valuation Report is an in-depth analysis detailing your home's value as well as a comparison with similar homes in the area
Home Values in the Area
Average Home Value in this Area
Purchase History
| Date | Buyer | Sale Price | Title Company |
|---|---|---|---|
| Allman Steven H | -- | Signature Title Ins Agency I | |
| Homolik Mathew Scott | -- | -- | |
| Nordhoff Gary | -- | -- |
Source: Public Records
Mortgage History
| Date | Status | Borrower | Loan Amount |
|---|---|---|---|
| Open | Allman Steven H | $147,682 | |
| Previous Owner | Homolik Mathew Scott | $118,750 |
Source: Public Records
Tax History Compared to Growth
Tax History
| Year | Tax Paid | Tax Assessment Tax Assessment Total Assessment is a certain percentage of the fair market value that is determined by local assessors to be the total taxable value of land and additions on the property. | Land | Improvement |
|---|---|---|---|---|
| 2025 | $2,360 | $237,545 | $170,200 | $261,700 |
| 2024 | $2,360 | $232,320 | $0 | $0 |
| 2023 | $2,344 | $227,425 | $0 | $0 |
| 2022 | $2,323 | $227,260 | $0 | $0 |
| 2021 | $1,805 | $308,000 | $93,400 | $214,600 |
| 2020 | $1,750 | $280,000 | $84,900 | $195,100 |
| 2019 | $1,608 | $267,600 | $84,900 | $182,700 |
| 2018 | $1,403 | $236,800 | $77,900 | $158,900 |
| 2017 | $1,252 | $116,050 | $0 | $0 |
| 2016 | $1,223 | $105,710 | $0 | $0 |
| 2015 | $1,086 | $94,820 | $0 | $0 |
| 2014 | $944 | $85,965 | $0 | $0 |
Source: Public Records
Map
Nearby Homes
- 588 W 1720 S
- 655 W 1280 S
- 642 W 1870 S Unit 1046
- Oakridge (Crawl) Plan at Osprey Towns
- Dalton Plan at Osprey Towns
- Dumont Plan at Osprey Towns
- Millbrook (Crawl) Plan at Osprey Towns
- 914 W 1150 S Unit 2
- 908 W 1150 S Unit 3
- 661 W 1920 S Unit 1072
- 311 W 1610 S
- 1095 S 500 W Unit 11
- 985 S 600 W
- 1240 W 890 S
- 784 W Heather Ln
- 239 S Meadow Dr Unit 10
- 131 S Meadow Dr Unit 20
- 169 S Meadow Dr Unit 18
- 272 W 1020 S Unit B
- 761 W 600 S Unit 12