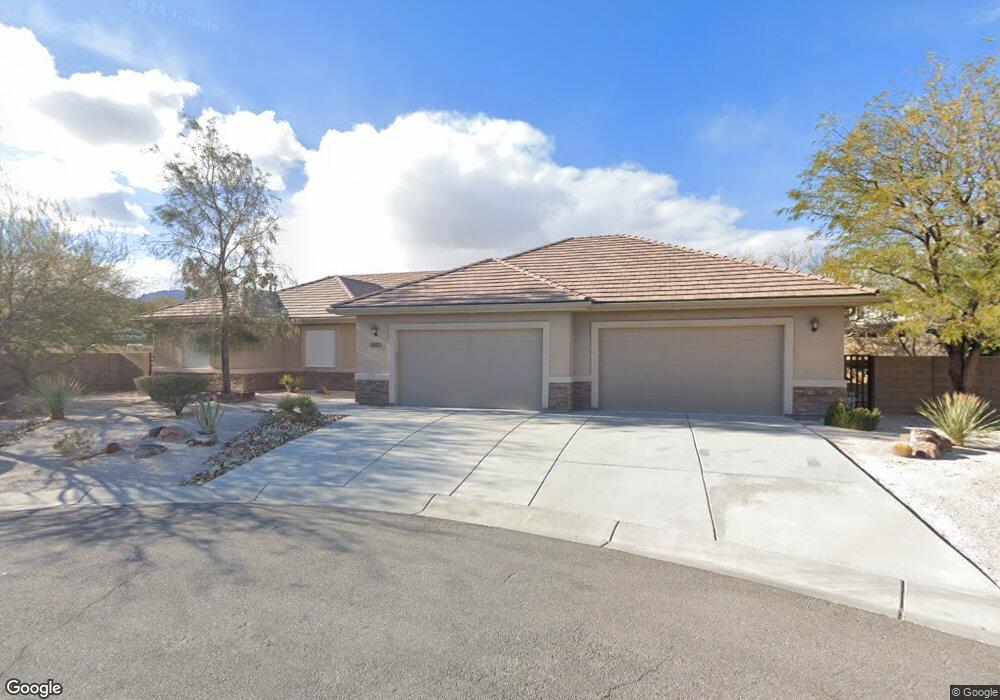
8880 W Fisher Ave Las Vegas, NV 89149
Estimated Value: $926,042 - $1,069,000
4
Beds
4
Baths
3,383
Sq Ft
$293/Sq Ft
Est. Value
About This Home
This home is located at 8880 W Fisher Ave, Las Vegas, NV 89149 and is currently estimated at $992,261, approximately $293 per square foot. 8880 W Fisher Ave is a home located in Clark County with nearby schools including Dean Lamar Allen Elementary School, Justice Myron E Leavitt Middle School, and Centennial High School.
Ownership History
Date
Name
Owned For
Owner Type
Purchase Details
Closed on
Jan 10, 2011
Sold by
Thom Ray and Thom Katherine
Bought by
Thom Ray and Thom Katherine
Current Estimated Value
Purchase Details
Closed on
Jul 23, 2002
Sold by
Thom Ray
Bought by
Thom Ray
Home Financials for this Owner
Home Financials are based on the most recent Mortgage that was taken out on this home.
Original Mortgage
$322,925
Interest Rate
6.7%
Mortgage Type
Construction
Purchase Details
Closed on
Jan 25, 2002
Sold by
Thom Family Trust
Bought by
Thom Ray
Create a Home Valuation Report for This Property
The Home Valuation Report is an in-depth analysis detailing your home's value as well as a comparison with similar homes in the area
Home Values in the Area
Average Home Value in this Area
Purchase History
| Date | Buyer | Sale Price | Title Company |
|---|---|---|---|
| Thom Ray | -- | None Available | |
| Thom Ray | -- | United Title | |
| Thom Ray | -- | -- |
Source: Public Records
Mortgage History
| Date | Status | Borrower | Loan Amount |
|---|---|---|---|
| Closed | Thom Ray | $322,925 |
Source: Public Records
Tax History Compared to Growth
Tax History
| Year | Tax Paid | Tax Assessment Tax Assessment Total Assessment is a certain percentage of the fair market value that is determined by local assessors to be the total taxable value of land and additions on the property. | Land | Improvement |
|---|---|---|---|---|
| 2025 | $4,202 | $277,843 | $80,500 | $197,343 |
| 2024 | $4,080 | $277,843 | $80,500 | $197,343 |
| 2023 | $4,278 | $264,117 | $78,750 | $185,367 |
| 2022 | $4,153 | $221,903 | $70,000 | $151,903 |
| 2021 | $3,846 | $206,292 | $61,250 | $145,042 |
| 2020 | $3,865 | $205,055 | $61,250 | $143,805 |
| 2019 | $3,686 | $202,786 | $61,250 | $141,536 |
| 2018 | $3,517 | $194,075 | $57,750 | $136,325 |
| 2017 | $4,681 | $171,709 | $42,000 | $129,709 |
| 2016 | $3,330 | $158,517 | $31,500 | $127,017 |
| 2015 | $3,324 | $145,096 | $17,500 | $127,596 |
| 2014 | $3,221 | $114,673 | $17,500 | $97,173 |
Source: Public Records
Map
Nearby Homes
- 11127 Rolling Vista Dr
- 8842 W Stephen Ave
- 9180 W Hammer Ln
- 5515 N Campbell Rd
- 8844 Alto Summit Ave
- 0 Dapple Gray Rd
- 5625 Coe Estates Ct
- 3336 Plan at Homestead West
- 3704 Plan at Homestead West
- 8732 Kendall Brook Cir
- 8828 Alto Summit Ave
- 5215 N Riley St
- 5624 N Dapple Gray Rd
- 5020 N Campbell Rd
- 5315 N Fort Apache Rd
- 5685 N Campbell Rd
- 5640 N Juliano Rd
- 5745 El Royale Ct
- 5309 N Chieftain St
- 5137 N Chieftain St
- 8890 W Fisher Ave
- 8870 W Fisher Ave
- 8865 W Hammer Ln
- 8860 W Fisher Ave
- 8910 W Fisher Ave
- 5345 Kevin Way
- 5375 Kevin Way
- 8885 W Hammer Ln
- 5335 N El Capitan Way
- 8920 W Fisher Ave
- 8855 W Hammer Ln
- 5325 N El Capitan Way
- 8911 W Hammer Ln
- 8891 W Fisher Ave
- 8835 W Hammer Ln
- 8861 W Fisher Ave
- 8940 W Fisher Ave
- 5345 N El Capitan Way
- 5275 N El Capitan Way