8888 Sweet Flag Loop E Southaven, MS 38671
Estimated Value: $226,000 - $273,337
About This Home
Please note, our homes are available on a first-come, first-serve basis and are not reserved until the lease is signed by all applicants and security deposits are collected.
This home features Progress Smart Home - Progress Residential's smart home app, which allows you to control the home securely from any of your devices. Learn more at
Want to tour on your own? Click the “Self Tour” button on this home’s listing or call to register for a self-guided showing at a time that works best for you.
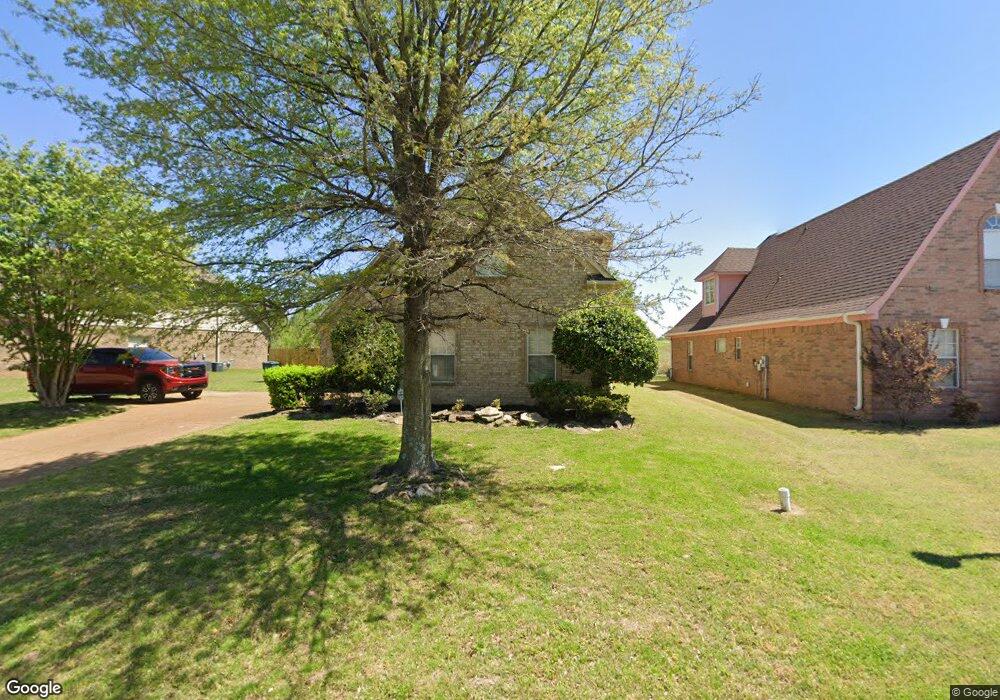
This brick rental home in Southaven, MS is lovely, pet-friendly, and available! It features four bedrooms, two and a half bathrooms, and a two-car attached garage. The primary bedroom, with its walk-in closet, is on the main floor. You'll love having dual vanity sinks and both a tub and stand-alone shower in the private en-suite bath. In the living room, you'll appreciate the gorgeous tray ceiling and lighted ceiling fan. A cozy fireplace completes the room. The kitchen is part of an entertainer's dream. It features stainless steel appliances, a handy kitchen island, and a walk-in pantry. Choose to eat in the breakfast nook, the formal dining room, or on the huge backyard deck. Tour this special home today!
Property History
| Date | Event | Price | List to Sale | Price per Sq Ft |
|---|---|---|---|---|
| 12/16/2024 12/16/24 | Off Market | $2,070 | -- | -- |
| 12/09/2024 12/09/24 | Price Changed | $2,070 | -0.5% | $1 / Sq Ft |
| 12/08/2024 12/08/24 | Price Changed | $2,080 | -0.7% | $1 / Sq Ft |
| 12/07/2024 12/07/24 | Price Changed | $2,095 | +0.7% | $1 / Sq Ft |
| 12/05/2024 12/05/24 | Price Changed | $2,080 | -0.5% | $1 / Sq Ft |
| 12/03/2024 12/03/24 | Price Changed | $2,090 | -0.5% | $1 / Sq Ft |
| 11/27/2024 11/27/24 | Price Changed | $2,100 | +0.5% | $1 / Sq Ft |
| 11/26/2024 11/26/24 | Price Changed | $2,090 | -0.5% | $1 / Sq Ft |
| 11/25/2024 11/25/24 | Price Changed | $2,100 | -0.2% | $1 / Sq Ft |
| 11/21/2024 11/21/24 | Price Changed | $2,105 | +0.5% | $1 / Sq Ft |
| 11/20/2024 11/20/24 | Price Changed | $2,095 | -0.2% | $1 / Sq Ft |
| 11/18/2024 11/18/24 | Price Changed | $2,100 | +0.5% | $1 / Sq Ft |
| 11/10/2024 11/10/24 | Price Changed | $2,090 | -1.2% | $1 / Sq Ft |
| 11/08/2024 11/08/24 | Price Changed | $2,115 | +0.2% | $1 / Sq Ft |
| 11/07/2024 11/07/24 | Price Changed | $2,110 | -0.2% | $1 / Sq Ft |
| 11/06/2024 11/06/24 | Price Changed | $2,115 | +0.2% | $1 / Sq Ft |
| 11/03/2024 11/03/24 | Price Changed | $2,110 | -0.2% | $1 / Sq Ft |
| 11/01/2024 11/01/24 | Price Changed | $2,115 | -0.2% | $1 / Sq Ft |
| 10/29/2024 10/29/24 | Price Changed | $2,120 | +0.2% | $1 / Sq Ft |
| 10/25/2024 10/25/24 | Price Changed | $2,115 | -0.2% | $1 / Sq Ft |
| 10/24/2024 10/24/24 | Price Changed | $2,120 | -0.2% | $1 / Sq Ft |
| 10/23/2024 10/23/24 | Price Changed | $2,125 | +0.2% | $1 / Sq Ft |
| 10/20/2024 10/20/24 | Price Changed | $2,120 | -0.2% | $1 / Sq Ft |
| 10/11/2024 10/11/24 | Price Changed | $2,125 | -0.2% | $1 / Sq Ft |
| 10/10/2024 10/10/24 | Price Changed | $2,130 | +0.2% | $1 / Sq Ft |
| 10/09/2024 10/09/24 | Price Changed | $2,125 | -0.2% | $1 / Sq Ft |
| 10/07/2024 10/07/24 | Price Changed | $2,130 | +0.2% | $1 / Sq Ft |
| 10/03/2024 10/03/24 | Price Changed | $2,125 | +1.7% | $1 / Sq Ft |
| 10/02/2024 10/02/24 | Price Changed | $2,090 | -26.7% | $1 / Sq Ft |
| 10/01/2024 10/01/24 | Price Changed | $2,850 | +40.4% | $1 / Sq Ft |
| 02/26/2024 02/26/24 | For Rent | $2,030 | -- | -- |
Tax History
| Year | Tax Paid | Tax Assessment Tax Assessment Total Assessment is a certain percentage of the fair market value that is determined by local assessors to be the total taxable value of land and additions on the property. | Land | Improvement |
|---|---|---|---|---|
| 2025 | $2,340 | $19,248 | $3,500 | $15,748 |
| 2024 | $2,077 | $14,296 | $3,500 | $10,796 |
| 2023 | $2,077 | $14,296 | $0 | $0 |
| 2022 | $2,034 | $14,296 | $3,500 | $10,796 |
| 2021 | $2,034 | $14,296 | $3,500 | $10,796 |
| 2020 | $1,909 | $13,414 | $3,500 | $9,914 |
| 2019 | $1,909 | $13,414 | $3,500 | $9,914 |
| 2017 | $1,888 | $22,906 | $13,203 | $9,703 |
| 2016 | $1,888 | $13,203 | $3,500 | $9,703 |
| 2015 | $1,881 | $22,906 | $13,203 | $9,703 |
| 2014 | $1,888 | $13,203 | $0 | $0 |
| 2013 | $1,827 | $13,203 | $0 | $0 |
Map
- 9022 Belmont Dr
- 3881 Farm Pond Cove W
- 0 Horn Lake Rd Unit 10654788
- 0 Horn Lake Rd Unit 25756508
- 8781 Mary Frances Dr
- 8865 Mary Frances Dr
- 8945 Mary Frances Dr
- 258 Nicolet Dr
- 0 E Holmes Rd Unit 10216573
- 0 E Holmes Rd Unit 10202561
- 8833 Ruth Ann Cove
- 0 Desoto Rd
- 375 Country Garden Dr
- 5163 Pickett Cove
- 396 W Holmes Rd
- 614 Emerald View Way
- 4304 Edwin Rd
- 4635 Rolling Green Rd
- 366 Washburn Dr
- 21 W van Huesen Dr
- 8902 Sweet Flag Loop E
- 8874 Sweet Flag Loop E
- 8862 Sweet Flag Loop E
- 8914 Sweet Flag Loop E
- 8905 Sweet Flag Loop E
- 8889 Sweet Flag Loop E
- 8919 Sweet Flag Loop E
- 8875 Sweet Flag Loop E
- 8926 Sweet Flag Loop E
- 8861 Sweet Flag Loop E
- 8848 Sweet Flag Loop
- 8849 Sweet Flag Loop E
- 8925 Sweet Flag Loop E
- 8940 Sweet Flag Loop E
- 8832 Sweet Flag Loop E
- 8834 Sweet Flag Loop
- 8835 Sweet Flag Loop E
- 8876 Sweet Flag Loop W
- 8945 Sweet Flag Loop E
- 8886 Sweet Flag Loop W
Ask me questions while you tour the home.