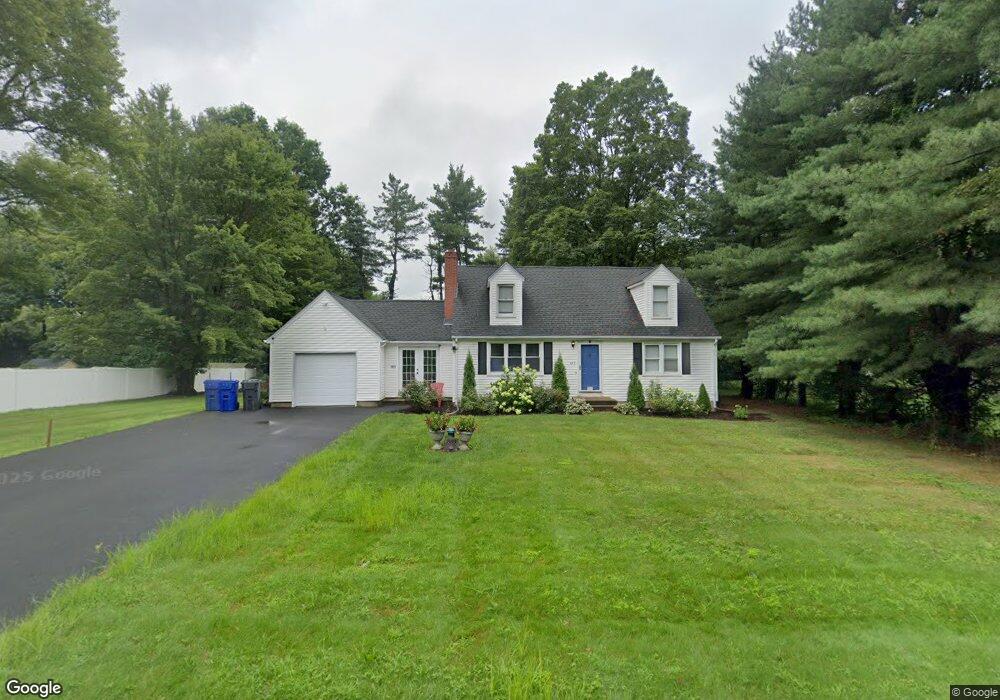
889 Bridge St Suffield, CT 06078
Estimated Value: $240,000 - $395,000
2
Beds
1
Bath
910
Sq Ft
$356/Sq Ft
Est. Value
About This Home
This home is located at 889 Bridge St, Suffield, CT 06078 and is currently estimated at $323,879, approximately $355 per square foot. 889 Bridge St is a home located in Hartford County with nearby schools including A. Ward Spaulding School, Mcalister Intermediate School, and Suffield Middle School.
Ownership History
Date
Name
Owned For
Owner Type
Purchase Details
Closed on
Jan 20, 2015
Sold by
Us Bank Na
Bought by
Drost John R and Drost Karen M
Current Estimated Value
Home Financials for this Owner
Home Financials are based on the most recent Mortgage that was taken out on this home.
Original Mortgage
$4,500
Interest Rate
4%
Purchase Details
Closed on
Dec 15, 2008
Sold by
Beneski Frank
Bought by
Bartini David
Home Financials for this Owner
Home Financials are based on the most recent Mortgage that was taken out on this home.
Original Mortgage
$207,824
Interest Rate
6.49%
Create a Home Valuation Report for This Property
The Home Valuation Report is an in-depth analysis detailing your home's value as well as a comparison with similar homes in the area
Home Values in the Area
Average Home Value in this Area
Purchase History
| Date | Buyer | Sale Price | Title Company |
|---|---|---|---|
| Drost John R | $132,000 | -- | |
| Bartini David | $215,000 | -- |
Source: Public Records
Mortgage History
| Date | Status | Borrower | Loan Amount |
|---|---|---|---|
| Previous Owner | Bartini David | $4,500 | |
| Previous Owner | Bartini David | $51,736 | |
| Previous Owner | Bartini David | $215,000 | |
| Previous Owner | Bartini David | $207,824 |
Source: Public Records
Tax History
| Year | Tax Paid | Tax Assessment Tax Assessment Total Assessment is a certain percentage of the fair market value that is determined by local assessors to be the total taxable value of land and additions on the property. | Land | Improvement |
|---|---|---|---|---|
| 2025 | $3,895 | $166,390 | $57,960 | $108,430 |
| 2024 | $3,765 | $166,390 | $57,960 | $108,430 |
| 2023 | $3,735 | $130,550 | $57,890 | $72,660 |
| 2022 | $3,735 | $130,550 | $57,890 | $72,660 |
| 2021 | $3,739 | $130,550 | $57,890 | $72,660 |
| 2020 | $3,739 | $130,550 | $57,890 | $72,660 |
| 2019 | $3,749 | $130,550 | $57,890 | $72,660 |
| 2018 | $3,639 | $124,110 | $55,580 | $68,530 |
| 2017 | $3,586 | $124,110 | $55,580 | $68,530 |
| 2016 | $3,500 | $124,110 | $55,580 | $68,530 |
| 2015 | $3,448 | $124,110 | $55,580 | $68,530 |
| 2014 | $3,366 | $124,110 | $55,580 | $68,530 |
Source: Public Records
Map
Nearby Homes
- 779 Bridge St
- 713 Thrall Ave
- 424 Bridge St
- 2 Pearl Street Extension
- 610 East St S
- 3 Pebblestone Cir Unit 3
- 11 Orchard Hill Dr
- 660 East St S
- 270 Pearl St
- 147 W Grayling Ln
- 5 Bridge Ln
- 840 Branch Rd
- 105 1st St
- 98 1st St
- 1.5 Bridge Ln
- 230 E Bass Ln
- 242 Pearl St
- 392 Boston Neck Rd
- 61 Brandywine Ln
- 6 Grand View Dr
Your Personal Tour Guide
Ask me questions while you tour the home.