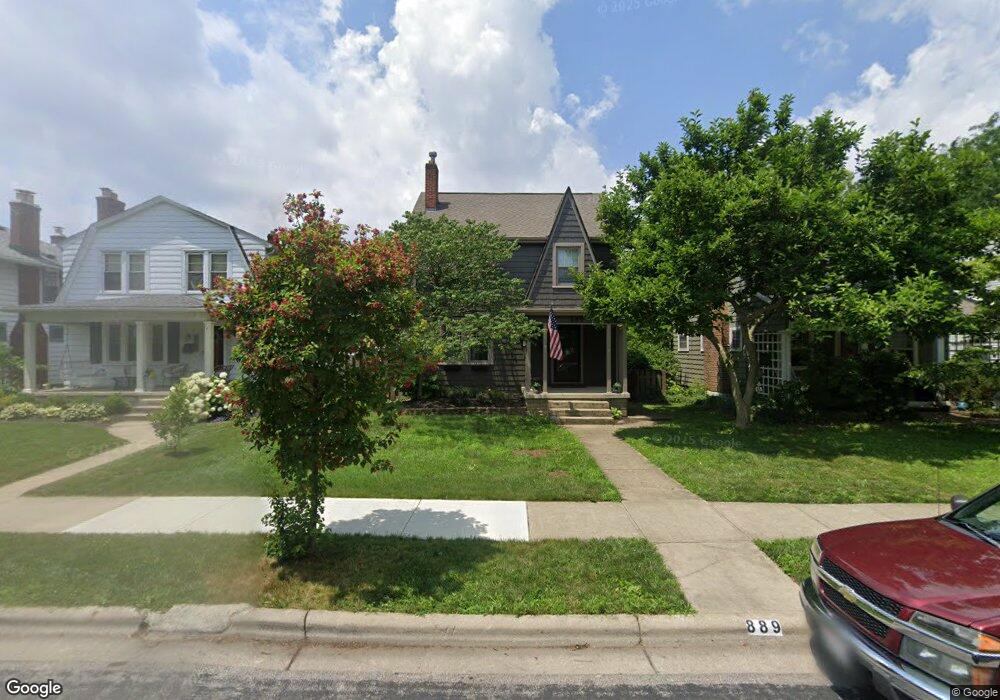
889 Montrose Ave Columbus, OH 43209
Estimated Value: $439,000 - $536,000
3
Beds
3
Baths
1,808
Sq Ft
$277/Sq Ft
Est. Value
About This Home
This home is located at 889 Montrose Ave, Columbus, OH 43209 and is currently estimated at $500,068, approximately $276 per square foot. 889 Montrose Ave is a home located in Franklin County with nearby schools including Montrose Elementary School, Bexley Middle School, and Bexley High School.
Ownership History
Date
Name
Owned For
Owner Type
Purchase Details
Closed on
Oct 29, 1999
Sold by
Berndt Jeffrey A and Berndt Debbie L
Bought by
Callahan Richard D and Callahan Barbara L
Current Estimated Value
Home Financials for this Owner
Home Financials are based on the most recent Mortgage that was taken out on this home.
Original Mortgage
$128,000
Interest Rate
7.87%
Purchase Details
Closed on
Dec 2, 1993
Bought by
Berndt Jeffrey A
Create a Home Valuation Report for This Property
The Home Valuation Report is an in-depth analysis detailing your home's value as well as a comparison with similar homes in the area
Home Values in the Area
Average Home Value in this Area
Purchase History
| Date | Buyer | Sale Price | Title Company |
|---|---|---|---|
| Callahan Richard D | $175,000 | Hummel Title Agency Inc | |
| Berndt Jeffrey A | $132,500 | -- |
Source: Public Records
Mortgage History
| Date | Status | Borrower | Loan Amount |
|---|---|---|---|
| Previous Owner | Callahan Richard D | $128,000 |
Source: Public Records
Tax History Compared to Growth
Tax History
| Year | Tax Paid | Tax Assessment Tax Assessment Total Assessment is a certain percentage of the fair market value that is determined by local assessors to be the total taxable value of land and additions on the property. | Land | Improvement |
|---|---|---|---|---|
| 2024 | $7,138 | $128,530 | $40,920 | $87,610 |
| 2023 | $6,417 | $128,520 | $40,915 | $87,605 |
| 2022 | $6,402 | $102,980 | $19,850 | $83,130 |
| 2021 | $6,407 | $102,980 | $19,850 | $83,130 |
| 2020 | $6,351 | $102,980 | $19,850 | $83,130 |
| 2019 | $6,065 | $86,530 | $16,560 | $69,970 |
| 2018 | $4,949 | $86,530 | $16,560 | $69,970 |
| 2017 | $4,879 | $86,530 | $16,560 | $69,970 |
| 2016 | $4,615 | $70,950 | $15,720 | $55,230 |
| 2015 | $4,629 | $70,950 | $15,720 | $55,230 |
| 2014 | $4,655 | $70,950 | $15,720 | $55,230 |
| 2013 | $2,305 | $67,585 | $14,980 | $52,605 |
Source: Public Records
Map
Nearby Homes
- 905 Vernon Rd
- 891 Vernon Rd
- 782 S Remington Rd
- 945 Francis Ave
- 895 Grandon Ave
- 1052 S Roosevelt Ave
- 696 Vernon Rd
- 866-868 Sheridan Ave
- 789 Chelsea Ave
- 843 Kenwick Rd
- 1000 S Dawson Ave Unit 302
- 563 S Dawson Ave
- 2424 Sherwood Rd
- 2425 Bryden Rd
- 811 S Chesterfield Rd
- 2676 Tudor Rd
- 2530 Berwick Blvd
- 1205 Kenwick Rd
- 2856 Eastminster Rd
- 723-725 S Chesterfield Rd
- 885 Montrose Ave
- 897 Montrose Ave
- 881 Montrose Ave
- 901 Montrose Ave
- 875 Montrose Ave
- 909 Montrose Ave
- 886 S Cassingham Rd
- 880 S Cassingham Rd
- 890 S Cassingham Rd
- 876 S Cassingham Rd
- 896 S Cassingham Rd
- 869 Montrose Ave
- 915 Montrose Ave
- 892 Montrose Ave
- 898 Montrose Ave
- 888 Montrose Ave
- 870 S Cassingham Rd
- 904 Montrose Ave
- 902 S Cassingham Rd
- 882 Montrose Ave