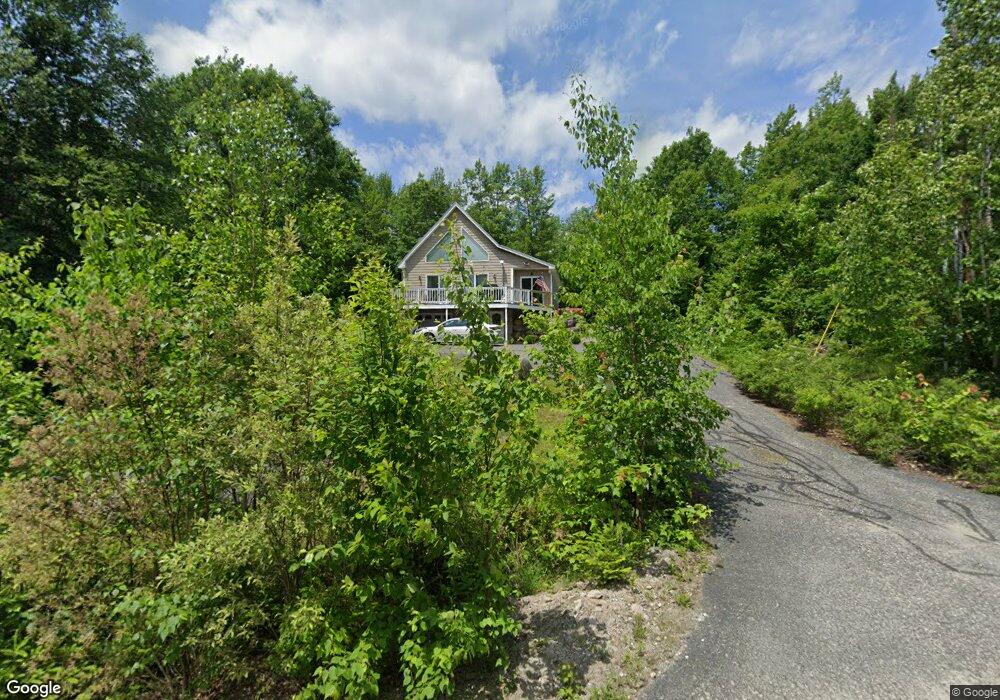
89 Deer Run Rd Bethlehem, NH 03574
Estimated Value: $320,000 - $471,000
2
Beds
3
Baths
1,536
Sq Ft
$265/Sq Ft
Est. Value
About This Home
This home is located at 89 Deer Run Rd, Bethlehem, NH 03574 and is currently estimated at $407,637, approximately $265 per square foot. 89 Deer Run Rd is a home located in Grafton County with nearby schools including Bethlehem Elementary School, Profile Junior High School, and Profile Senior High School.
Ownership History
Date
Name
Owned For
Owner Type
Purchase Details
Closed on
Oct 31, 2024
Sold by
Roy Anthony J and Roy Gerarda M
Bought by
Anthony J & G M Roy Ret and Roy
Current Estimated Value
Purchase Details
Closed on
Mar 5, 2012
Sold by
Couture Gerard R and Couture Debra J
Bought by
Roy Anthony J and Roy Gerarda M
Create a Home Valuation Report for This Property
The Home Valuation Report is an in-depth analysis detailing your home's value as well as a comparison with similar homes in the area
Home Values in the Area
Average Home Value in this Area
Purchase History
| Date | Buyer | Sale Price | Title Company |
|---|---|---|---|
| Anthony J & G M Roy Ret | -- | None Available | |
| Anthony J & G M Roy Ret | -- | None Available | |
| Anthony J & G M Roy Ret | -- | None Available | |
| Roy Anthony J | $160,000 | -- | |
| Roy Anthony J | $160,000 | -- |
Source: Public Records
Mortgage History
| Date | Status | Borrower | Loan Amount |
|---|---|---|---|
| Closed | Roy Anthony J | $0 |
Source: Public Records
Tax History Compared to Growth
Tax History
| Year | Tax Paid | Tax Assessment Tax Assessment Total Assessment is a certain percentage of the fair market value that is determined by local assessors to be the total taxable value of land and additions on the property. | Land | Improvement |
|---|---|---|---|---|
| 2024 | $5,254 | $305,800 | $51,900 | $253,900 |
| 2023 | $4,718 | $305,800 | $51,900 | $253,900 |
| 2022 | $4,611 | $193,000 | $24,400 | $168,600 |
| 2021 | $4,700 | $189,600 | $24,400 | $165,200 |
| 2020 | $4 | $189,600 | $24,400 | $165,200 |
| 2019 | $832 | $189,600 | $24,400 | $165,200 |
| 2018 | $8,853 | $189,600 | $24,400 | $165,200 |
| 2017 | $8,807 | $153,400 | $28,300 | $125,100 |
| 2016 | $8,246 | $153,400 | $28,300 | $125,100 |
| 2015 | $4,544 | $153,400 | $28,300 | $125,100 |
| 2013 | $4,380 | $153,400 | $28,300 | $125,100 |
Source: Public Records
Map
Nearby Homes
- 0 Thorn Hill Rd Unit 22 5063258
- 61 Thorn Hill Rd
- 14 Hilltop Manor Mobile Home Park
- 686 Wing Rd
- 78 Hazen Rd
- 191 Washington St
- 11 Richmond St
- 0 Sugar Wood Ln Unit 8
- 16 3rd St
- 15 Okane Ave
- 14 Reid Cir
- 45 Point of View Dr
- 180 Beacon St
- 114 Highland Ave
- 757 Maple St
- 42 Maple St
- 80 Guider Ln
- 00 Guider Ln
- 93 Pleasant St
- 36 MacIver Rd
- Lot 17 Deer Run
- 17 Deer Run Rd
- 104 Deer Run Rd
- 46 Oak Ridge Rd
- 91 Oak Ridge Rd
- 120 Deer Run Rd
- 437 Whitefield Rd
- 0 Deer Run Rd
- Lot 17 Deer Run Rd
- 00 Oak Ridge Rd
- 000 Oak Ridge Rd
- 00 Oak Ridge Rd Unit 13
- 133 Oak Ridge Rd
- *** Oak Ridge Rd
- 0 Oak Ridge Rd
- 152 Oak Ridge Rd
- 173 Whitefield Rd
- 49 Whitefield Rd
- 369 Whitefield Rd
- 49.5 Deer Run