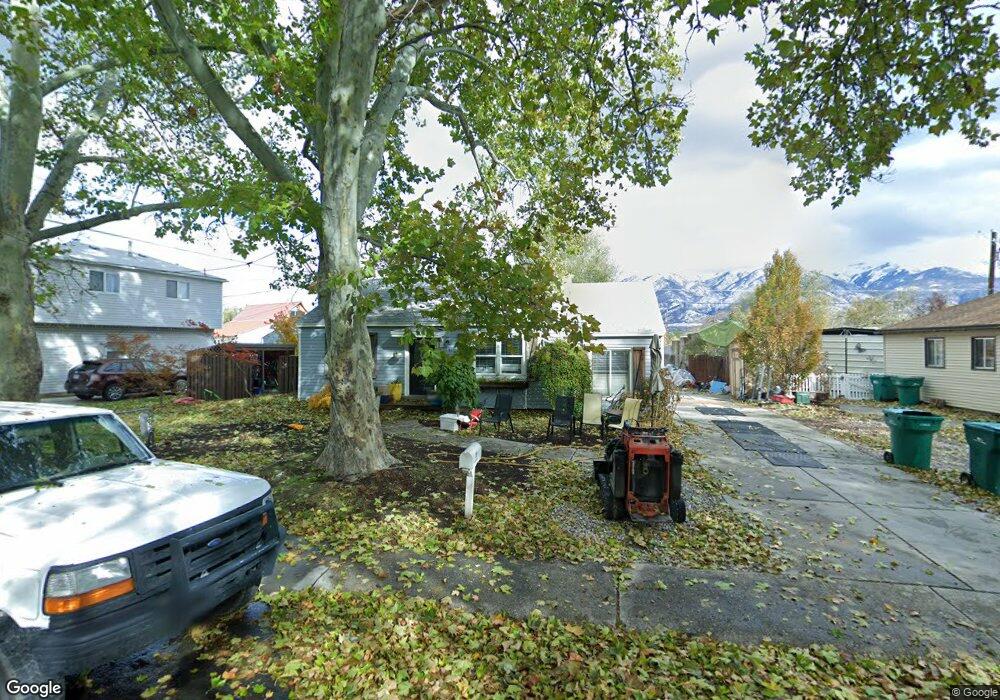
89 Ellison St Layton, UT 84041
Estimated Value: $355,000 - $419,000
3
Beds
1
Bath
1,100
Sq Ft
$343/Sq Ft
Est. Value
About This Home
This home is located at 89 Ellison St, Layton, UT 84041 and is currently estimated at $377,576, approximately $343 per square foot. 89 Ellison St is a home located in Davis County with nearby schools including Layton Elementary School, Fairfield Junior High School, and Layton High School.
Ownership History
Date
Name
Owned For
Owner Type
Purchase Details
Closed on
Mar 26, 2009
Sold by
Elliott Robert Allen
Bought by
Badger Dustin and Badger Megan
Current Estimated Value
Home Financials for this Owner
Home Financials are based on the most recent Mortgage that was taken out on this home.
Original Mortgage
$131,572
Outstanding Balance
$83,751
Interest Rate
5.15%
Mortgage Type
FHA
Estimated Equity
$293,825
Purchase Details
Closed on
Jul 13, 2007
Sold by
Ferrin Eric and Ferrin Annette
Bought by
Elliott Robert Allen
Home Financials for this Owner
Home Financials are based on the most recent Mortgage that was taken out on this home.
Original Mortgage
$99,000
Interest Rate
6.41%
Mortgage Type
Purchase Money Mortgage
Purchase Details
Closed on
Jul 21, 1997
Sold by
Nelson Darrin D and Nelson Kami
Bought by
Ferrin Eric and Ferrin Annette
Home Financials for this Owner
Home Financials are based on the most recent Mortgage that was taken out on this home.
Original Mortgage
$79,755
Interest Rate
7.83%
Mortgage Type
FHA
Create a Home Valuation Report for This Property
The Home Valuation Report is an in-depth analysis detailing your home's value as well as a comparison with similar homes in the area
Home Values in the Area
Average Home Value in this Area
Purchase History
| Date | Buyer | Sale Price | Title Company |
|---|---|---|---|
| Badger Dustin | -- | American Secure Title Stc | |
| Elliott Robert Allen | -- | Bonneville Superior Title Co | |
| Ferrin Eric | -- | U S Title |
Source: Public Records
Mortgage History
| Date | Status | Borrower | Loan Amount |
|---|---|---|---|
| Open | Badger Dustin | $131,572 | |
| Previous Owner | Elliott Robert Allen | $99,000 | |
| Previous Owner | Ferrin Eric | $79,755 |
Source: Public Records
Tax History
| Year | Tax Paid | Tax Assessment Tax Assessment Total Assessment is a certain percentage of the fair market value that is determined by local assessors to be the total taxable value of land and additions on the property. | Land | Improvement |
|---|---|---|---|---|
| 2025 | $1,645 | $172,700 | $123,902 | $48,798 |
| 2024 | $1,581 | $167,200 | $134,239 | $32,961 |
| 2023 | $1,529 | $285,000 | $138,534 | $146,466 |
| 2022 | $1,630 | $165,000 | $82,795 | $82,205 |
| 2021 | $1,305 | $197,000 | $124,191 | $72,809 |
| 2020 | $1,195 | $173,000 | $105,497 | $67,503 |
| 2019 | $1,192 | $169,000 | $105,815 | $63,185 |
| 2018 | $1,011 | $144,000 | $93,075 | $50,925 |
| 2016 | $918 | $67,430 | $37,810 | $29,620 |
| 2015 | $831 | $57,915 | $37,810 | $20,105 |
| 2014 | $722 | $51,462 | $37,810 | $13,652 |
| 2013 | -- | $64,438 | $20,680 | $43,758 |
Source: Public Records
Map
Nearby Homes
- 88 Ellison St
- 339 W 25 N Unit 6
- 355 W Gentile St
- 356 W 25 N
- 361 W 50 N
- 418 W Gentile St
- 24 Grover St
- 189 S Main St Unit 76
- 189 S Main St Unit 21
- 753 S 300 E
- 350 Church St
- 771 W Gentile St
- 750 W Gentile St
- 80 E 850 S
- 282 E 925 S
- 22 E 525 N
- 383 S 950 W
- 149 N Fort Ln Unit 1D
- 220 W 590 N
- 933 W Gentile St
Your Personal Tour Guide
Ask me questions while you tour the home.