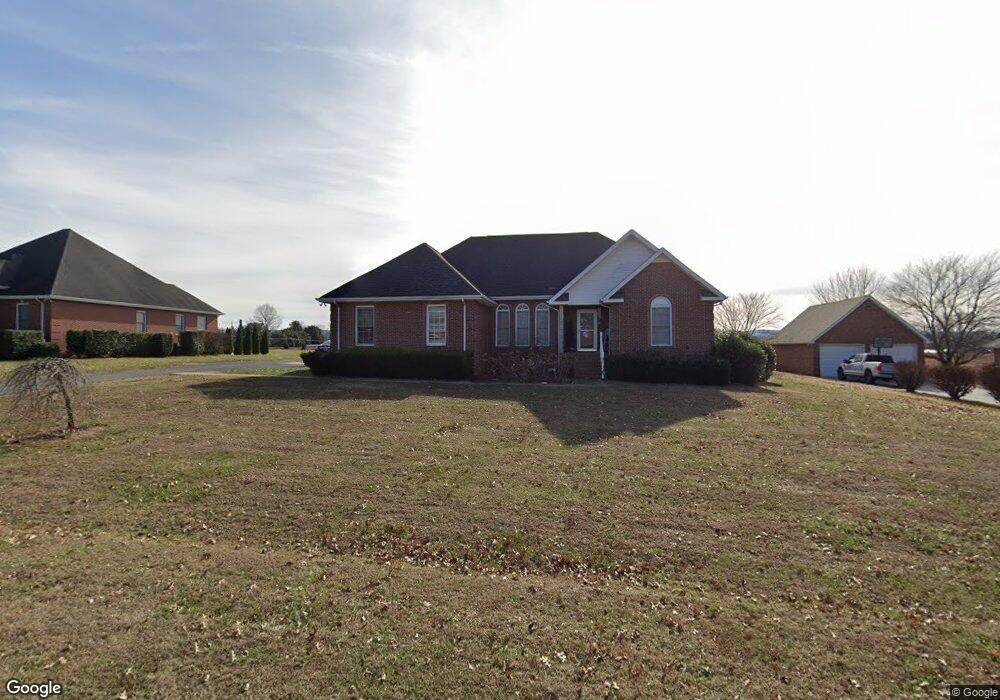
89 Favre Cir Winchester, TN 37398
Estimated Value: $309,196 - $425,000
--
Bed
2
Baths
1,864
Sq Ft
$196/Sq Ft
Est. Value
About This Home
This home is located at 89 Favre Cir, Winchester, TN 37398 and is currently estimated at $365,549, approximately $196 per square foot. 89 Favre Cir is a home located in Franklin County with nearby schools including South Middle School, Franklin County High School, and Winchester Christian Academy.
Ownership History
Date
Name
Owned For
Owner Type
Purchase Details
Closed on
Oct 23, 2018
Sold by
Peck Pamela S
Bought by
Lankford Donnie and Lankford Leanne
Current Estimated Value
Home Financials for this Owner
Home Financials are based on the most recent Mortgage that was taken out on this home.
Original Mortgage
$167,887
Outstanding Balance
$147,544
Interest Rate
4.87%
Mortgage Type
FHA
Estimated Equity
$218,005
Purchase Details
Closed on
Jun 9, 2008
Sold by
Mpj Enterprises Llc
Bought by
Peck Pamela S
Purchase Details
Closed on
Jul 13, 2007
Sold by
Brown Linda
Bought by
Mpj Enterprises Llc
Purchase Details
Closed on
Jul 24, 2006
Sold by
Zheng Dai Mei By Aif
Bought by
Brown Linda
Home Financials for this Owner
Home Financials are based on the most recent Mortgage that was taken out on this home.
Original Mortgage
$104,000
Interest Rate
6.68%
Purchase Details
Closed on
Feb 5, 2001
Bought by
Dai Meizheng and Chen Bin
Create a Home Valuation Report for This Property
The Home Valuation Report is an in-depth analysis detailing your home's value as well as a comparison with similar homes in the area
Home Values in the Area
Average Home Value in this Area
Purchase History
| Date | Buyer | Sale Price | Title Company |
|---|---|---|---|
| Lankford Donnie | $180,000 | None Available | |
| Peck Pamela S | -- | -- | |
| Mpj Enterprises Llc | $158,500 | -- | |
| Brown Linda | $130,000 | -- | |
| Dai Meizheng | $118,000 | -- |
Source: Public Records
Mortgage History
| Date | Status | Borrower | Loan Amount |
|---|---|---|---|
| Open | Lankford Donnie | $167,887 | |
| Previous Owner | Dai Meizheng | $104,000 |
Source: Public Records
Tax History Compared to Growth
Tax History
| Year | Tax Paid | Tax Assessment Tax Assessment Total Assessment is a certain percentage of the fair market value that is determined by local assessors to be the total taxable value of land and additions on the property. | Land | Improvement |
|---|---|---|---|---|
| 2024 | $0 | $72,400 | $15,000 | $57,400 |
| 2023 | $1,861 | $72,400 | $15,000 | $57,400 |
| 2022 | $1,825 | $72,400 | $15,000 | $57,400 |
| 2021 | $1,026 | $72,400 | $15,000 | $57,400 |
| 2020 | $1,394 | $40,050 | $5,250 | $34,800 |
| 2019 | $1,394 | $39,425 | $5,250 | $34,175 |
| 2018 | $1,313 | $39,425 | $5,250 | $34,175 |
| 2017 | $1,313 | $39,425 | $5,250 | $34,175 |
| 2016 | $1,190 | $35,725 | $4,650 | $31,075 |
| 2015 | $1,168 | $35,725 | $4,650 | $31,075 |
| 2014 | $1,167 | $35,710 | $0 | $0 |
Source: Public Records
Map
Nearby Homes
- 0 Deer Valley Cir Unit RTC2980817
- 0 Deer Valley Cir Unit RTC2980816
- 0 Deer Valley Cir Unit RTC2980815
- 0 Deer Valley Cir Unit RTC2980813
- 0 Deer Valley Cir Unit RTC2980812
- 0 Deer Valley Cir Unit RTC2980811
- 0 Deer Valley Cir Unit RTC2980810
- 0 Deer Valley Cir Unit RTC2980808
- 0 Deer Valley Cir Unit RTC2980805
- 0 Deer Valley Cir Unit RTC2980803
- 0 Deer Valley Cir Unit RTC2980802
- 0 Deer Valley Cir Unit RTC2980801
- 0 Deer Valley Cir Unit RTC2980798
- 0 Deer Valley Cir Unit RTC2980797
- 0 Deer Valley Cir Unit RTC2980794
- 0 Deer Valley Cir Unit RTC2980792
- 0 Deer Valley Cir Unit RTC2980791
- 0 Deer Valley Cir Unit RTC2980788
- 0 Deer Valley Cir Unit RTC2980787
- 0 Deer Valley Cir Unit RTC2980786