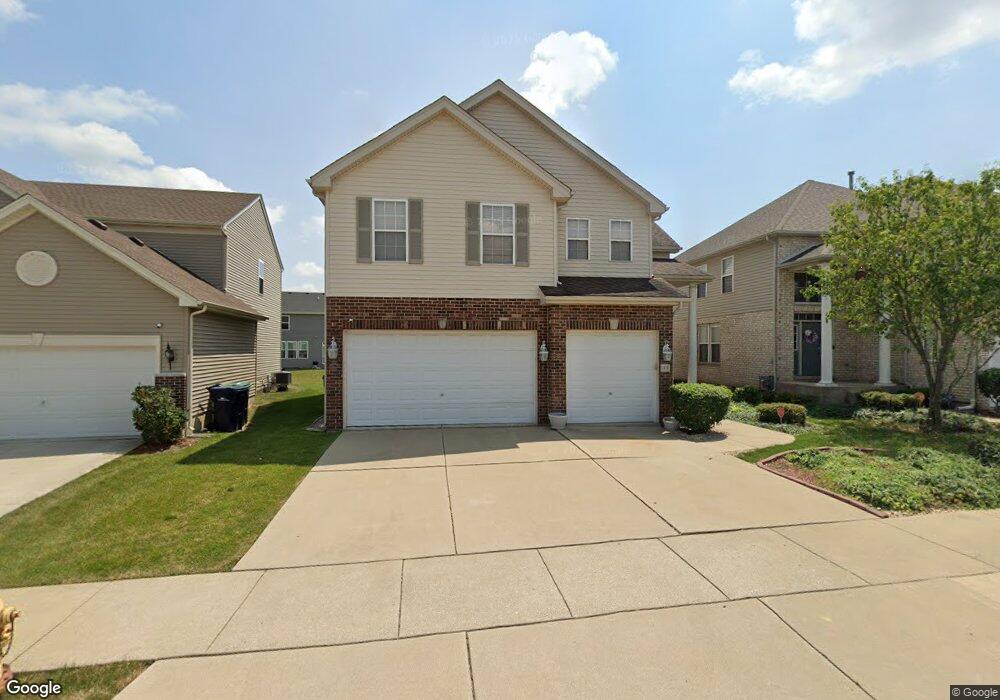
89 Henson Ct Matteson, IL 60443
Old Matteson NeighborhoodEstimated Value: $344,000 - $419,000
3
Beds
3
Baths
2,393
Sq Ft
$156/Sq Ft
Est. Value
About This Home
This home is located at 89 Henson Ct, Matteson, IL 60443 and is currently estimated at $373,632, approximately $156 per square foot. 89 Henson Ct is a home located in Cook County with nearby schools including Colin Powell Middle School and Southland College Prep.
Ownership History
Date
Name
Owned For
Owner Type
Purchase Details
Closed on
Feb 27, 2025
Sold by
Soyode-Onatolu Hilda S and Soyode Hilda S
Bought by
Soyode Family Revocable Living Trust and Soyode-Onatolu
Current Estimated Value
Purchase Details
Closed on
Feb 24, 2006
Sold by
Enclave At Brookmere Llc
Bought by
Soyode Hilda S
Home Financials for this Owner
Home Financials are based on the most recent Mortgage that was taken out on this home.
Original Mortgage
$271,674
Interest Rate
6.42%
Mortgage Type
Balloon
Create a Home Valuation Report for This Property
The Home Valuation Report is an in-depth analysis detailing your home's value as well as a comparison with similar homes in the area
Home Values in the Area
Average Home Value in this Area
Purchase History
| Date | Buyer | Sale Price | Title Company |
|---|---|---|---|
| Soyode Family Revocable Living Trust | -- | None Listed On Document | |
| Soyode Hilda S | $339,000 | Multiple |
Source: Public Records
Mortgage History
| Date | Status | Borrower | Loan Amount |
|---|---|---|---|
| Previous Owner | Soyode Hilda S | $271,674 |
Source: Public Records
Tax History Compared to Growth
Tax History
| Year | Tax Paid | Tax Assessment Tax Assessment Total Assessment is a certain percentage of the fair market value that is determined by local assessors to be the total taxable value of land and additions on the property. | Land | Improvement |
|---|---|---|---|---|
| 2024 | $10,376 | $29,554 | $5,847 | $23,707 |
| 2023 | $8,694 | $31,000 | $5,847 | $25,153 |
| 2022 | $8,694 | $22,397 | $5,045 | $17,352 |
| 2021 | $7,416 | $22,395 | $5,044 | $17,351 |
| 2020 | $8,779 | $22,395 | $5,044 | $17,351 |
| 2019 | $7,740 | $20,340 | $4,586 | $15,754 |
| 2018 | $7,252 | $20,340 | $4,586 | $15,754 |
| 2017 | $11,781 | $25,877 | $4,586 | $21,291 |
| 2016 | $8,855 | $19,609 | $4,127 | $15,482 |
| 2015 | $9,681 | $21,675 | $4,127 | $17,548 |
| 2014 | $10,715 | $21,675 | $4,127 | $17,548 |
| 2013 | $8,415 | $18,292 | $4,127 | $14,165 |
Source: Public Records
Map
Nearby Homes
- 98 Lawrence Ln
- 72 Kenneth St
- 175 Owen St
- 192 Owen St
- 202 Owen St
- 246 Owen St
- 312 Grafton Place
- 340 Maryview Ct
- 255 Central Ave
- 4500 203rd St
- 322 Central Ave
- 135 Treehouse Rd
- 153 Treehouse Rd
- 5628 Crestwood Rd
- 5728 Woodgate Dr
- 116 Cloverleaf Rd
- 111 Deerpath Rd
- 5808 Allemong Dr
- 820 School Ave
- 858 Academy Ave