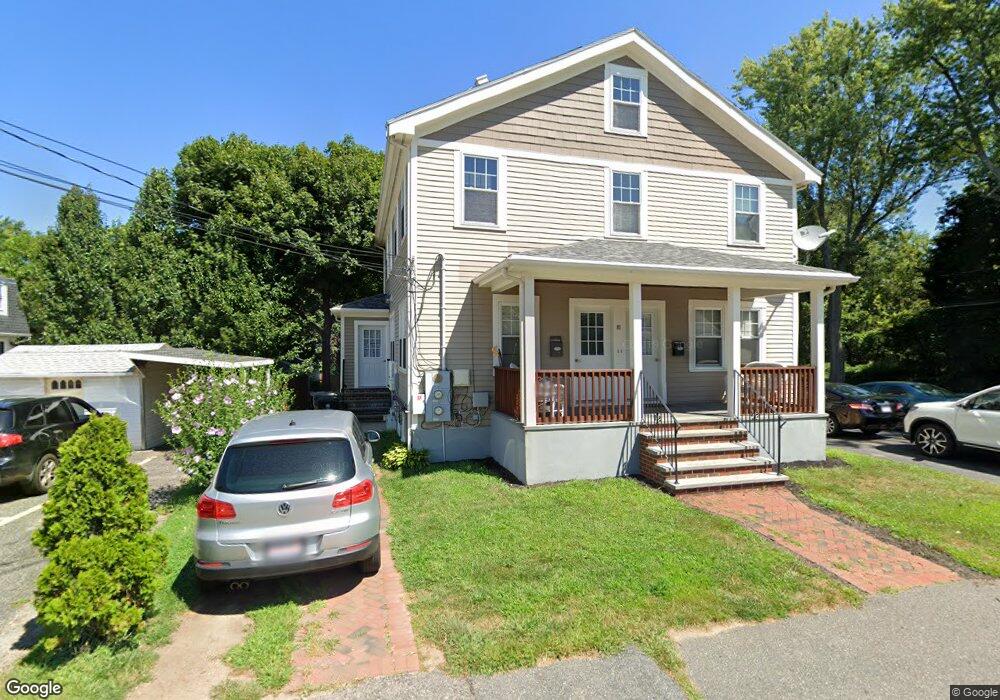
89 Nipmuc Rd Framingham, MA 01702
Estimated Value: $641,000 - $731,373
5
Beds
2
Baths
1,720
Sq Ft
$409/Sq Ft
Est. Value
About This Home
This home is located at 89 Nipmuc Rd, Framingham, MA 01702 and is currently estimated at $703,593, approximately $409 per square foot. 89 Nipmuc Rd is a home located in Middlesex County with nearby schools including Framingham High School, Pincushion Hill Montessori School, and Happy Hollow School.
Ownership History
Date
Name
Owned For
Owner Type
Purchase Details
Closed on
May 15, 2001
Sold by
Macura Theresa D and Chouinard Celestina A
Bought by
Pessote Eusa A and Pessote Roselmo C
Current Estimated Value
Home Financials for this Owner
Home Financials are based on the most recent Mortgage that was taken out on this home.
Original Mortgage
$223,198
Interest Rate
6.88%
Mortgage Type
Purchase Money Mortgage
Create a Home Valuation Report for This Property
The Home Valuation Report is an in-depth analysis detailing your home's value as well as a comparison with similar homes in the area
Home Values in the Area
Average Home Value in this Area
Purchase History
| Date | Buyer | Sale Price | Title Company |
|---|---|---|---|
| Pessote Eusa A | $240,000 | -- |
Source: Public Records
Mortgage History
| Date | Status | Borrower | Loan Amount |
|---|---|---|---|
| Open | Pessote Eusa A | $270,655 | |
| Closed | Pessote Eusa A | $223,198 |
Source: Public Records
Tax History
| Year | Tax Paid | Tax Assessment Tax Assessment Total Assessment is a certain percentage of the fair market value that is determined by local assessors to be the total taxable value of land and additions on the property. | Land | Improvement |
|---|---|---|---|---|
| 2025 | $7,865 | $658,700 | $203,600 | $455,100 |
| 2024 | $7,111 | $570,700 | $181,000 | $389,700 |
| 2023 | $6,942 | $530,300 | $161,800 | $368,500 |
| 2022 | $6,937 | $504,900 | $146,800 | $358,100 |
| 2021 | $6,500 | $462,600 | $141,000 | $321,600 |
| 2020 | $6,158 | $411,100 | $122,900 | $288,200 |
| 2019 | $5,548 | $360,700 | $117,100 | $243,600 |
| 2018 | $5,247 | $321,500 | $109,000 | $212,500 |
| 2017 | $4,829 | $289,000 | $105,000 | $184,000 |
| 2016 | $4,945 | $284,500 | $99,300 | $185,200 |
| 2015 | $4,373 | $245,400 | $100,300 | $145,100 |
Source: Public Records
Map
Nearby Homes
- 131 Mellen St Unit 3B
- 69 Gilbert St
- 768 Waverley St
- 24 Bates Rd
- 15 Bates Rd
- 10 Rhubena St
- 25 Eames St
- 45 Daytona Ave
- 77 Arlington St
- 27 Gordon St Unit 305
- 29 Gordon St Unit 107
- 146 E Union St
- 20 Mulhall Dr
- 15 Bellmore Rd
- 120 Franklin St
- 51 Crest Rd
- 18 Beaver Ct
- 116 Waverly St
- 12 & 14 Waverly St
- 37 James Rd
Your Personal Tour Guide
Ask me questions while you tour the home.