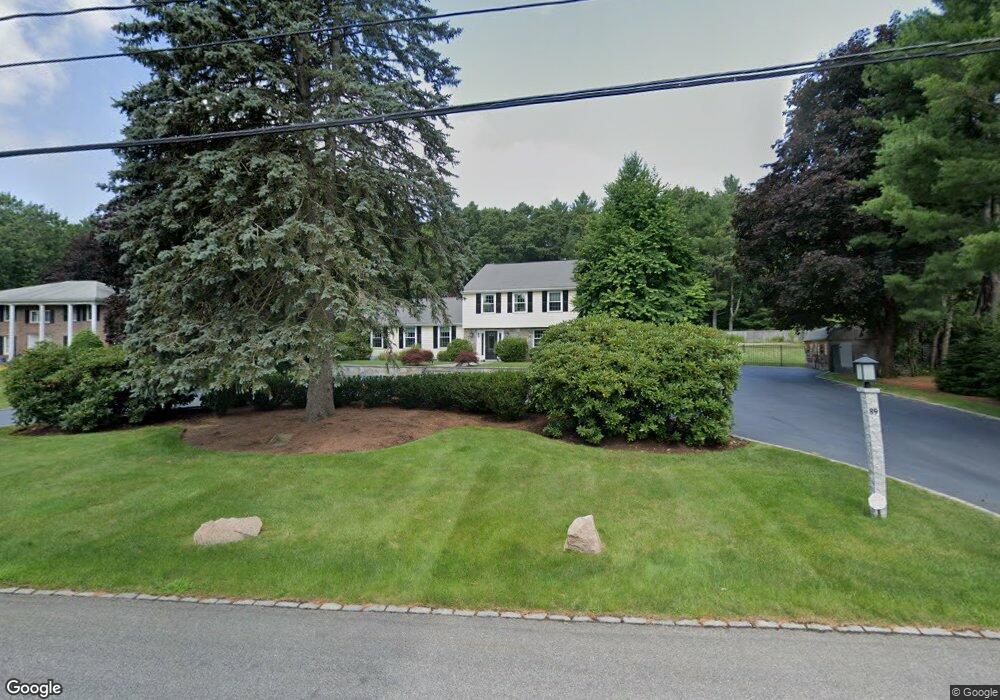
89 Oxbow Rd Needham, MA 02492
Estimated Value: $1,591,000 - $2,360,448
4
Beds
4
Baths
1,293
Sq Ft
$1,450/Sq Ft
Est. Value
About This Home
This home is located at 89 Oxbow Rd, Needham, MA 02492 and is currently estimated at $1,875,362, approximately $1,450 per square foot. 89 Oxbow Rd is a home located in Norfolk County with nearby schools including Newman Elementary School, High Rock Middle School, and Pollard Middle School.
Ownership History
Date
Name
Owned For
Owner Type
Purchase Details
Closed on
Nov 23, 2021
Sold by
Hammer Norman and Hammer Randy B
Bought by
89 Oxbow Road Nt
Current Estimated Value
Purchase Details
Closed on
Nov 16, 1998
Sold by
Sciarratta Marilyn A
Bought by
Hammer Norman and Hammer Randy B
Purchase Details
Closed on
Aug 24, 1992
Sold by
Brady Cornelius W and Brady Margaret S
Bought by
Sciarratta Marilyn A
Create a Home Valuation Report for This Property
The Home Valuation Report is an in-depth analysis detailing your home's value as well as a comparison with similar homes in the area
Home Values in the Area
Average Home Value in this Area
Purchase History
| Date | Buyer | Sale Price | Title Company |
|---|---|---|---|
| 89 Oxbow Road Nt | -- | None Available | |
| Hammer Norman | $617,000 | -- | |
| Sciarratta Marilyn A | $425,000 | -- |
Source: Public Records
Mortgage History
| Date | Status | Borrower | Loan Amount |
|---|---|---|---|
| Previous Owner | Sciarratta Marilyn A | $365,000 | |
| Previous Owner | Sciarratta Marilyn A | $380,000 | |
| Previous Owner | Sciarratta Marilyn A | $385,000 |
Source: Public Records
Tax History
| Year | Tax Paid | Tax Assessment Tax Assessment Total Assessment is a certain percentage of the fair market value that is determined by local assessors to be the total taxable value of land and additions on the property. | Land | Improvement |
|---|---|---|---|---|
| 2025 | $17,822 | $1,681,300 | $933,600 | $747,700 |
| 2024 | $18,362 | $1,466,600 | $824,100 | $642,500 |
| 2023 | $18,589 | $1,425,500 | $824,100 | $601,400 |
| 2022 | $17,138 | $1,281,800 | $697,900 | $583,900 |
| 2021 | $15,843 | $1,215,900 | $697,900 | $518,000 |
| 2020 | $15,085 | $1,207,800 | $697,900 | $509,900 |
| 2019 | $14,844 | $1,198,100 | $697,900 | $500,200 |
| 2018 | $14,233 | $1,198,100 | $697,900 | $500,200 |
| 2017 | $14,056 | $1,182,200 | $732,900 | $449,300 |
| 2016 | $13,705 | $1,187,600 | $732,900 | $454,700 |
| 2015 | $13,408 | $1,187,600 | $732,900 | $454,700 |
| 2014 | $12,716 | $1,092,400 | $732,900 | $359,500 |
Source: Public Records
Map
Nearby Homes
- 1780 Central Ave
- 365 Charles River St
- 24 Moseley Ave
- 37 Carleton Dr
- 34 Stratford Rd
- 60 Claybrook Rd
- 62 Claybrook Rd
- 52 Willow St
- 8 Crestview Rd
- 189 Bridle Trail Rd
- 1 Mill St
- 68 Locust Ln
- 389 Grove St
- 95 Deerfield Rd
- 333 Cartwright Rd
- 620 High Rock St
- 182 Winding River Rd
- 222 Grove St
- 12 Winding River Cir
- 287 High Rock St
Your Personal Tour Guide
Ask me questions while you tour the home.