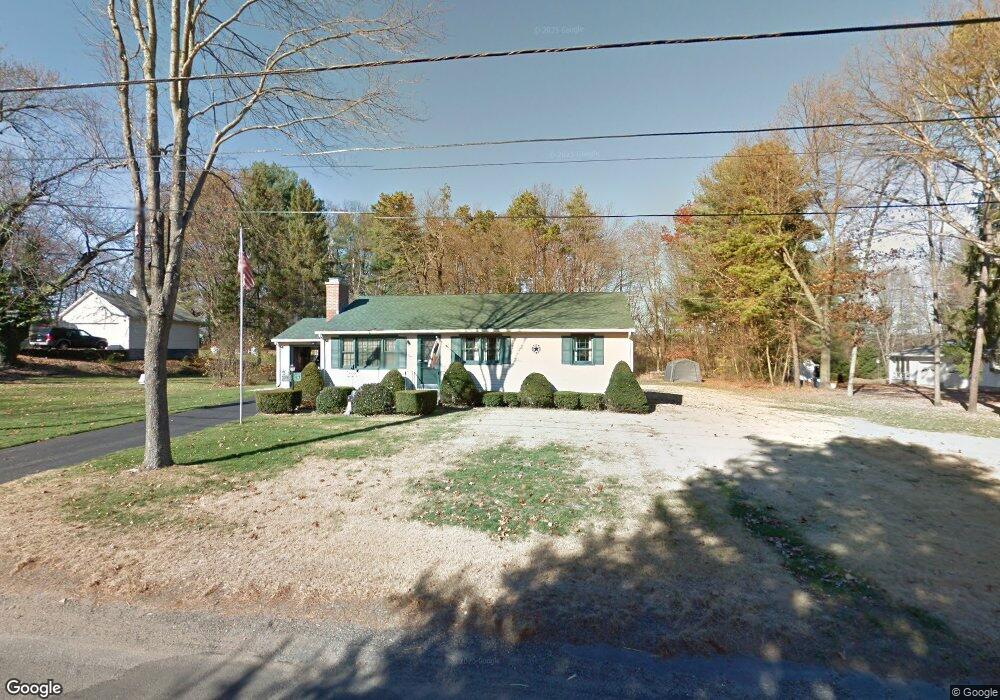
89 Plain St Easthampton, MA 01027
Estimated Value: $301,000 - $378,000
3
Beds
2
Baths
1,161
Sq Ft
$302/Sq Ft
Est. Value
About This Home
This home is located at 89 Plain St, Easthampton, MA 01027 and is currently estimated at $350,273, approximately $301 per square foot. 89 Plain St is a home located in Hampshire County with nearby schools including Easthampton High School, Calvary Baptist Christian School, and Tri-County Schools.
Ownership History
Date
Name
Owned For
Owner Type
Purchase Details
Closed on
Apr 22, 2020
Sold by
Ethier Gene P
Bought by
Ethier Gene P and Ethier Brenda L
Current Estimated Value
Home Financials for this Owner
Home Financials are based on the most recent Mortgage that was taken out on this home.
Original Mortgage
$151,000
Outstanding Balance
$133,155
Interest Rate
3.5%
Mortgage Type
New Conventional
Estimated Equity
$217,118
Purchase Details
Closed on
Apr 21, 2020
Sold by
Ethier William C and Ethier Charles J
Bought by
Ethier Gene P
Home Financials for this Owner
Home Financials are based on the most recent Mortgage that was taken out on this home.
Original Mortgage
$151,000
Outstanding Balance
$133,155
Interest Rate
3.5%
Mortgage Type
New Conventional
Estimated Equity
$217,118
Create a Home Valuation Report for This Property
The Home Valuation Report is an in-depth analysis detailing your home's value as well as a comparison with similar homes in the area
Home Values in the Area
Average Home Value in this Area
Purchase History
| Date | Buyer | Sale Price | Title Company |
|---|---|---|---|
| Ethier Gene P | -- | None Available | |
| Ethier Gene P | $120,000 | None Available |
Source: Public Records
Mortgage History
| Date | Status | Borrower | Loan Amount |
|---|---|---|---|
| Open | Ethier Gene P | $151,000 | |
| Closed | Ethier Gene P | $151,000 |
Source: Public Records
Tax History
| Year | Tax Paid | Tax Assessment Tax Assessment Total Assessment is a certain percentage of the fair market value that is determined by local assessors to be the total taxable value of land and additions on the property. | Land | Improvement |
|---|---|---|---|---|
| 2025 | $4,206 | $307,700 | $106,800 | $200,900 |
| 2024 | $4,061 | $299,500 | $103,800 | $195,700 |
| 2023 | $3,082 | $210,400 | $81,800 | $128,600 |
| 2022 | $3,478 | $210,400 | $81,800 | $128,600 |
| 2021 | $3,804 | $216,900 | $81,800 | $135,100 |
| 2020 | $3,737 | $210,400 | $81,800 | $128,600 |
| 2019 | $3,134 | $202,700 | $81,800 | $120,900 |
| 2018 | $3,002 | $187,600 | $77,100 | $110,500 |
| 2017 | $2,931 | $180,800 | $74,100 | $106,700 |
| 2016 | $2,819 | $180,800 | $74,100 | $106,700 |
| 2015 | $2,739 | $180,800 | $74,100 | $106,700 |
Source: Public Records
Map
Nearby Homes
Your Personal Tour Guide
Ask me questions while you tour the home.