C
Landlord's Agent in 2024
Christine Bethoney
Discover Properties
(781) 844-7742
1 in this area
36 Total Sales

Estimated Value: $251,000 - $310,000
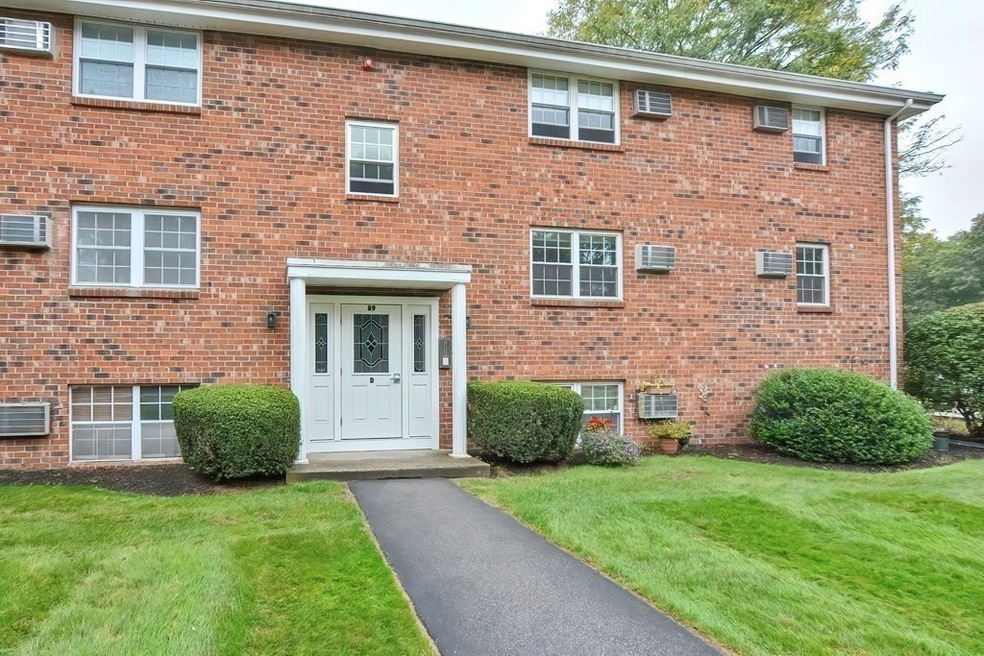
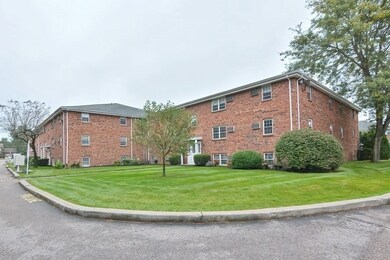
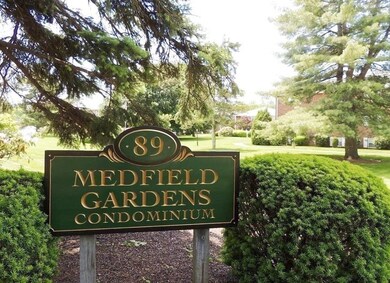
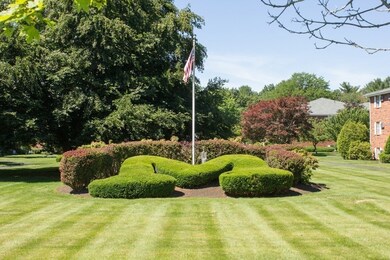
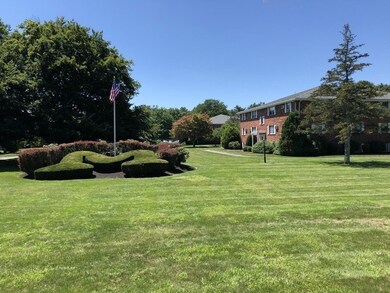
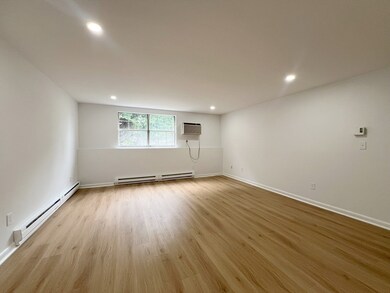
Vacant and available for immediate occupancy. Gorgeous, completely remodeled 631 sq' 1 bedroom, garden level condominium located in desired Medfield Gardens. Features include a beautiful, brand new kitchen with quartz counters, stainless appliances, recessed lighting and quartz backsplash. Spacious living room, big bedroom, brand new tiled full bath, brand new engineered flooring, built in wall ac and common coin operated laundry. There's off street parking for 1 car (space #76), inground pool and grill area, beautiful grounds and landscaping. Condo provides the perfect in-town location with shopping, library, schools, dining, pharmacy, and Metacomet Park nearby with tennis courts, playground and ball fields. Tenant pays electricity for heat, hot water, cooking, lights, outlets and wall ac. Tenant pays first and last month's rent to the landlord and a half month rental fee to listing agency. The owner requires good credit, a cori report, references and verification of income.
| Date | Buyer | Sale Price | Title Company |
|---|---|---|---|
| Baaklini Joseph | -- | None Available | |
| Baaklini Joseph | -- | None Available | |
| Baaklini Joseph | -- | None Available | |
| Baaklini Joseph G | $225,000 | None Available | |
| Baaklini Joseph G | $225,000 | None Available | |
| Baaklini Joseph G | $225,000 | None Available |
| Date | Status | Borrower | Loan Amount |
|---|---|---|---|
| Open | Baaklini Joseph | $168,750 | |
| Closed | Baaklini Joseph | $168,750 |
| Date | Event | Price | List to Sale | Price per Sq Ft | Prior Sale |
|---|---|---|---|---|---|
| 10/17/2024 10/17/24 | Rented | $1,850 | 0.0% | -- | |
| 10/13/2024 10/13/24 | Under Contract | -- | -- | -- | |
| 09/24/2024 09/24/24 | For Rent | $1,850 | 0.0% | -- | |
| 04/11/2022 04/11/22 | Sold | $225,000 | -2.2% | $357 / Sq Ft | View Prior Sale |
| 03/08/2022 03/08/22 | Pending | -- | -- | -- | |
| 03/02/2022 03/02/22 | For Sale | $230,000 | 0.0% | $365 / Sq Ft | |
| 05/29/2020 05/29/20 | Rented | $1,400 | 0.0% | -- | |
| 05/13/2020 05/13/20 | Under Contract | -- | -- | -- | |
| 04/14/2020 04/14/20 | Price Changed | $1,400 | -6.7% | $2 / Sq Ft | |
| 04/06/2020 04/06/20 | For Rent | $1,500 | -- | -- |
| Year | Tax Paid | Tax Assessment Tax Assessment Total Assessment is a certain percentage of the fair market value that is determined by local assessors to be the total taxable value of land and additions on the property. | Land | Improvement |
|---|---|---|---|---|
| 2025 | $3,024 | $219,100 | $0 | $219,100 |
| 2024 | $2,887 | $197,200 | $0 | $197,200 |
| 2023 | $2,794 | $181,100 | $0 | $181,100 |
| 2022 | $2,782 | $159,700 | $0 | $159,700 |
| 2021 | $2,700 | $152,000 | $0 | $152,000 |
| 2020 | $2,617 | $146,800 | $0 | $146,800 |
| 2019 | $2,448 | $137,000 | $0 | $137,000 |
| 2018 | $2,056 | $120,700 | $0 | $120,700 |
| 2017 | $1,996 | $118,200 | $0 | $118,200 |
| 2016 | $1,980 | $118,200 | $0 | $118,200 |
| 2015 | $1,609 | $100,300 | $0 | $100,300 |
| 2014 | $1,539 | $95,500 | $0 | $95,500 |
C
Landlord's Agent in 2024
Christine Bethoney
Discover Properties
(781) 844-7742
1 in this area
36 Total Sales

Seller's Agent in 2022
Dennis Folan
Coldwell Banker Realty - Westwood
(508) 801-6444
8 in this area
79 Total Sales
Buyer's Agent in 2022
John Bethoney
Discover Properties
(781) 844-7741
1 in this area
100 Total Sales
Seller's Agent in 2020
William Wright
RE/MAX
(508) 223-7200
30 Total Sales
Source: MLS Property Information Network (MLS PIN)
MLS Number: 73294131
APN: 25000113054
Disclaimer: Certain information contained herein is derived from information provided by parties other than Homes.com. All information provided is deemed reliable, but is not guaranteed to be accurate and should be independently verified.
![]() The property listing data and information, or the Images, set forth herein were provided to MLS Property Information Network, Inc. from third party sources, including sellers, lessors and public records, and were compiled by MLS Property Information Network, Inc. The property listing data and information, and the Images, are for the personal, non-commercial use of consumers having a good faith interest in purchasing or leasing listed properties of the type displayed to them and may not be used for any purpose other than to identify prospective properties which such consumers may have a good faith interest in purchasing or leasing. MLS Property Information Network, Inc. and its subscribers disclaim any and all representations and warranties as to the accuracy of the property listing data and information, or as to the accuracy of any of the Images, set forth herein.
The property listing data and information, or the Images, set forth herein were provided to MLS Property Information Network, Inc. from third party sources, including sellers, lessors and public records, and were compiled by MLS Property Information Network, Inc. The property listing data and information, and the Images, are for the personal, non-commercial use of consumers having a good faith interest in purchasing or leasing listed properties of the type displayed to them and may not be used for any purpose other than to identify prospective properties which such consumers may have a good faith interest in purchasing or leasing. MLS Property Information Network, Inc. and its subscribers disclaim any and all representations and warranties as to the accuracy of the property listing data and information, or as to the accuracy of any of the Images, set forth herein.