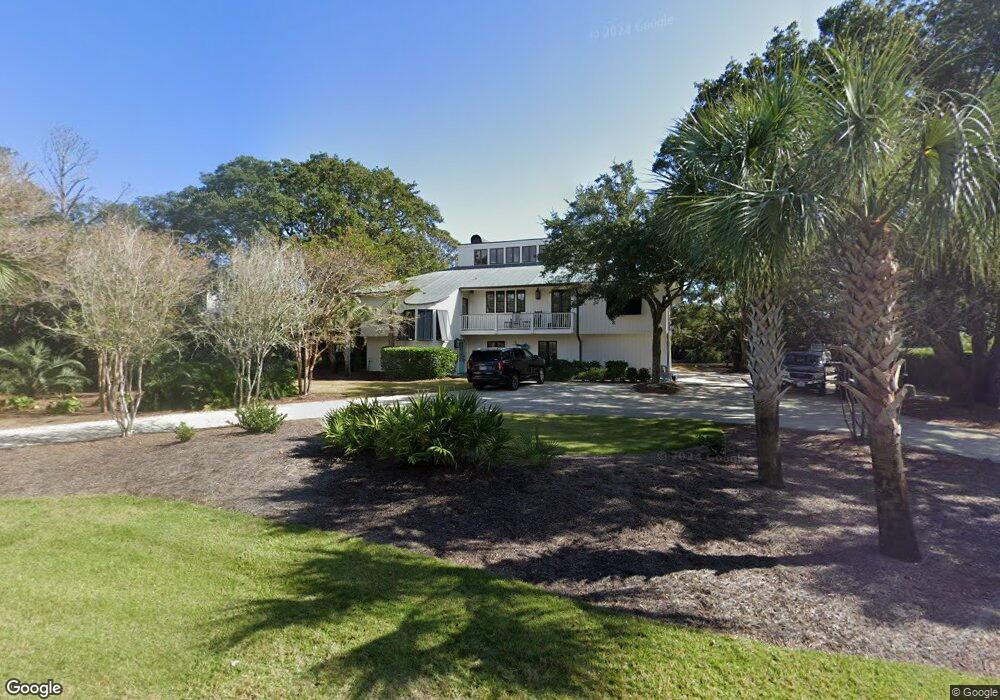
89 Prospect Point Loop Unit HOW Georgetown, SC 29440
Estimated Value: $786,213
5
Beds
6
Baths
3,977
Sq Ft
$198/Sq Ft
Est. Value
About This Home
This home is located at 89 Prospect Point Loop Unit HOW, Georgetown, SC 29440 and is currently estimated at $786,213, approximately $197 per square foot. 89 Prospect Point Loop Unit HOW is a home located in Georgetown County with nearby schools including Waccamaw Elementary School, Waccamaw Intermediate School, and Waccamaw Middle School.
Ownership History
Date
Name
Owned For
Owner Type
Purchase Details
Closed on
Jan 12, 2022
Sold by
Liaker Iii Dan M
Bought by
Litaker Dan M and Litaker Link Marrkham
Current Estimated Value
Home Financials for this Owner
Home Financials are based on the most recent Mortgage that was taken out on this home.
Original Mortgage
$1,500,000
Outstanding Balance
$1,373,796
Interest Rate
3.25%
Mortgage Type
New Conventional
Estimated Equity
-$587,583
Purchase Details
Closed on
Oct 7, 2013
Sold by
Howerton Philip F and Howerton Philip F
Bought by
Litaker Dan M
Purchase Details
Closed on
Dec 21, 2009
Sold by
Debidue Creek Llc
Bought by
Howerton Ii Philip F and Litaker Dan M
Purchase Details
Closed on
Aug 25, 2004
Sold by
Bowco Llc
Bought by
Howerton Philip F and Litaker Dan M
Purchase Details
Closed on
Nov 1, 2001
Sold by
Bowers H Tate and Bowers Richard L
Bought by
Bowco Llc
Create a Home Valuation Report for This Property
The Home Valuation Report is an in-depth analysis detailing your home's value as well as a comparison with similar homes in the area
Home Values in the Area
Average Home Value in this Area
Purchase History
| Date | Buyer | Sale Price | Title Company |
|---|---|---|---|
| Litaker Dan M | -- | None Listed On Document | |
| Litaker Dan M | -- | -- | |
| Litaker Dan M | $387,750 | -- | |
| Howerton Ii Philip F | -- | -- | |
| Howerton Philip F | $1,075,000 | -- | |
| Bowco Llc | -- | -- | |
| Bowco Llc | -- | -- | |
| Bowers Harry L | -- | -- |
Source: Public Records
Mortgage History
| Date | Status | Borrower | Loan Amount |
|---|---|---|---|
| Open | Litaker Dan M | $1,500,000 |
Source: Public Records
Tax History
| Year | Tax Paid | Tax Assessment Tax Assessment Total Assessment is a certain percentage of the fair market value that is determined by local assessors to be the total taxable value of land and additions on the property. | Land | Improvement |
|---|---|---|---|---|
| 2025 | $4,453 | $38,249 | $15,539 | $22,710 |
| 2024 | $4,453 | $49,890 | $24,000 | $25,890 |
| 2023 | $12,663 | $49,890 | $24,000 | $25,890 |
| 2022 | $11,745 | $49,890 | $24,000 | $25,890 |
| 2021 | $11,381 | $0 | $0 | $0 |
| 2020 | $11,366 | $0 | $0 | $0 |
| 2019 | $13,016 | $0 | $0 | $0 |
| 2018 | $13,074 | $0 | $0 | $0 |
| 2017 | $12,098 | $0 | $0 | $0 |
| 2016 | $13,345 | $63,792 | $0 | $0 |
| 2015 | $12,803 | $0 | $0 | $0 |
| 2014 | $12,803 | $1,053,100 | $656,300 | $396,800 |
| 2012 | -- | $1,053,100 | $656,300 | $396,800 |
Source: Public Records
Map
Nearby Homes
- 1059 Debordieu Blvd Unit 5
- 34 Dune Oaks Dr Unit DeBordieu Colony
- 139 Pioneer Loop
- 81 Ocean Green Dr
- 224 Ocean Green Dr
- 116 Summer Haven Ct Unit 11-B-2
- 191 Marsh Lake Dr Unit 25
- 2987 Luvan Blvd
- 261 Marsh Lake Dr Unit 19
- 100 Ocean Park Loop Unit DeBordieu Colony - O
- 160 Colony Pointe Dr
- 110 Swan Point Trail
- 58 Swan Point Trail
- 59 Nautica Way
- 703 Collins Meadow Dr
- Lot 173 Sanderling Ave
- 491 Blue Heron Dr
- 250 Pinckney Ln
- Lot 120 Calais Ave
- 20 Brandon Way
- 99 Prospect Point Loop Unit KEV
- 165 Prospect Point Loop
- 10 Rosetter Ct
- Lot 15 Prospect Place Loop
- Lot 15 Prospect Place Loop Unit Main Channel DeBordi
- Lot 15 Prospect Place Loop Unit Lot 15, Block 4, Pro
- 157 Prospect Point Loop
- 14 Rosetter Ct
- 14 Rosetter Ct Unit Lot 8, Block 5, Pros
- Lot 6 Prospect Point Loop Unit Lot 6 PROSPECT PLACE
- 0 Prospect Point Loop Unit Lot 26 PROSPECT PLAC
- 193 Prospect Point Loop Unit SI ID1312462P
- 193 Prospect Point Loop Unit ID1312462P
- 84 Tabby Ln Unit Debordieu
- 64 Rosetter Ct
- Lot 10 Rosetter Ct Unit Lot 10, Block 5, Por
- Lot 10 Rosetter Ct
- Lot 15 Prospect Point Loop Unit DeBordieu Colony
- Lot 15 Prospect Point Loop
- Lot 26 Blk 4 Prospect Place
Your Personal Tour Guide
Ask me questions while you tour the home.