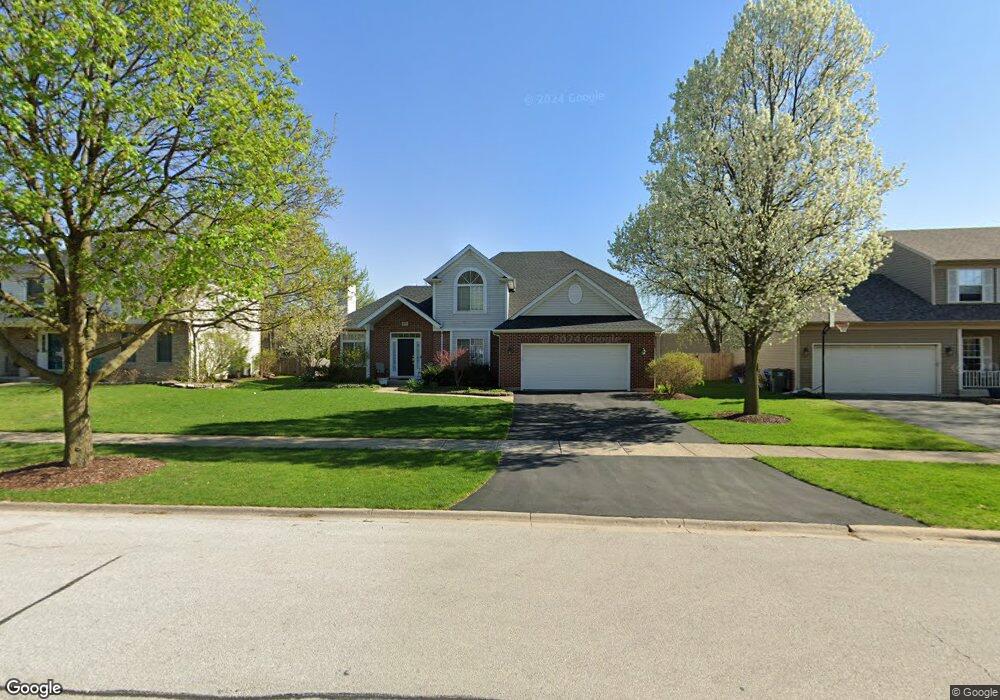
89 Red Fox Run Montgomery, IL 60538
Briarcliff Woods NeighborhoodEstimated Value: $392,340 - $417,000
Studio
1
Bath
2,067
Sq Ft
$195/Sq Ft
Est. Value
About This Home
This home is located at 89 Red Fox Run, Montgomery, IL 60538 and is currently estimated at $403,335, approximately $195 per square foot. 89 Red Fox Run is a home located in Kendall County with nearby schools including Boulder Hill Elementary School, Thompson Jr. High School, and Oswego High School.
Ownership History
Date
Name
Owned For
Owner Type
Purchase Details
Closed on
Jun 1, 1996
Bought by
Furstenau Richard S and Furstenau Heather
Current Estimated Value
Purchase Details
Closed on
Dec 1, 1995
Bought by
Furst Homes
Purchase Details
Closed on
Jan 1, 1988
Create a Home Valuation Report for This Property
The Home Valuation Report is an in-depth analysis detailing your home's value as well as a comparison with similar homes in the area
Home Values in the Area
Average Home Value in this Area
Purchase History
| Date | Buyer | Sale Price | Title Company |
|---|---|---|---|
| Furstenau Richard S | $155,000 | -- | |
| Furst Homes | $30,000 | -- | |
| -- | $394,000 | -- |
Source: Public Records
Mortgage History
| Date | Status | Borrower | Loan Amount |
|---|---|---|---|
| Closed | Furst Homes | -- |
Source: Public Records
Tax History
| Year | Tax Paid | Tax Assessment Tax Assessment Total Assessment is a certain percentage of the fair market value that is determined by local assessors to be the total taxable value of land and additions on the property. | Land | Improvement |
|---|---|---|---|---|
| 2024 | $9,344 | $118,940 | $24,831 | $94,109 |
| 2023 | $8,586 | $107,153 | $22,370 | $84,783 |
| 2022 | $8,586 | $98,306 | $20,523 | $77,783 |
| 2021 | $8,279 | $91,874 | $19,180 | $72,694 |
| 2020 | $7,872 | $86,673 | $18,094 | $68,579 |
| 2019 | $7,371 | $80,439 | $18,094 | $62,345 |
| 2018 | $7,551 | $80,439 | $18,094 | $62,345 |
| 2017 | $7,415 | $75,886 | $17,070 | $58,816 |
| 2016 | $7,300 | $73,676 | $16,573 | $57,103 |
| 2015 | $7,388 | $71,185 | $16,013 | $55,172 |
| 2014 | -- | $69,112 | $15,547 | $53,565 |
| 2013 | -- | $69,810 | $15,704 | $54,106 |
Source: Public Records
Map
Nearby Homes
- 4 Ingleshire Rd
- 75 Winter Hill Cir
- 16 Spring Garden Dr
- 310 Fairwind Ct
- 19 Wyndham Dr Unit 10
- 107 Fellemore Ln
- 40 Chatham Place
- 20 Durango Rd
- 1855 Grandview Place Unit 2B
- 1417 Manning Ave
- 142 Jefferson St
- 79 Pueblo Rd
- 122 Longbeach Rd
- 117 Boulder Hill Pass Unit 117
- 162 Heathgate Rd
- 34 Sonora Dr
- 119 Garden Dr
- 209 Huntington Ct
- 307 Huntington Ct
- 74 Paddock St
- 91 Red Fox Run Unit 2
- 87 Red Fox Run Unit 2
- 93 Red Fox Run Unit 2
- 85 Red Fox Run
- 88 Red Fox Run
- 95 Red Fox Run Unit 2
- 84 Red Fox Run Unit 2
- 83 Red Fox Run Unit 2
- 70 Fernwood Rd
- 68 Fernwood Rd
- 72 Fernwood Rd
- 1910 Ridgemont Ct
- 74 Fernwood Rd
- 66 Fernwood Rd
- 97 Red Fox Run
- 81 Red Fox Run
- 80 Red Fox Run Unit 2
- 76 Fernwood Rd
- 64 Fernwood Rd
- 1915 Ridgemont Ct
Your Personal Tour Guide
Ask me questions while you tour the home.