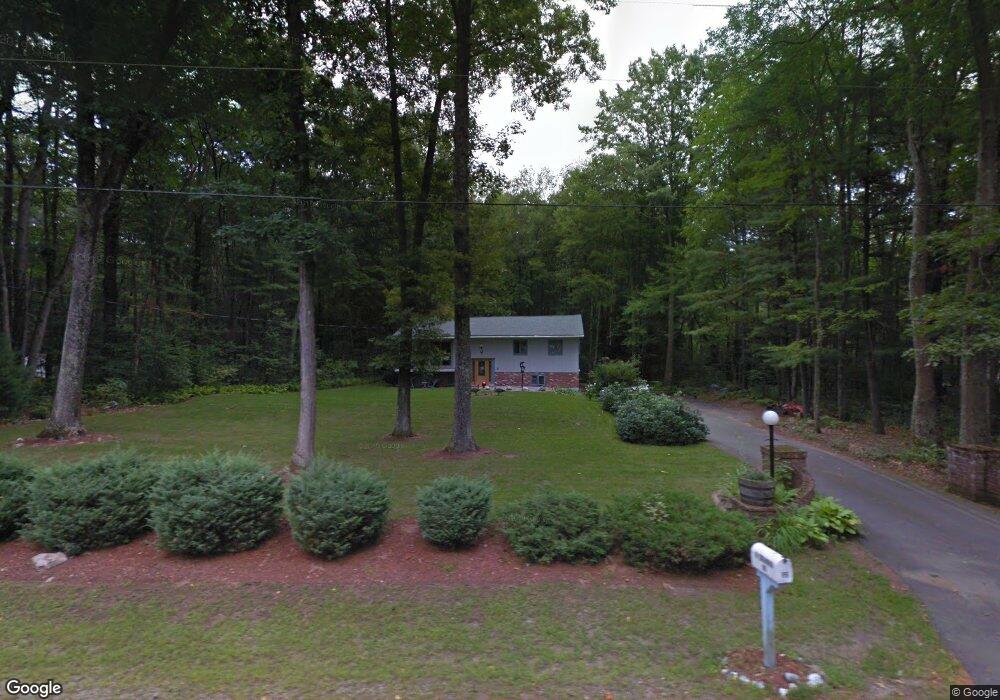
89 Sandy Pond Pkwy Bedford, NH 03110
Bedford NeighborhoodEstimated Value: $507,000 - $594,509
3
Beds
2
Baths
1,288
Sq Ft
$437/Sq Ft
Est. Value
About This Home
This home is located at 89 Sandy Pond Pkwy, Bedford, NH 03110 and is currently estimated at $563,377, approximately $437 per square foot. 89 Sandy Pond Pkwy is a home located in Hillsborough County with nearby schools including Mckelvie Intermediate School, Ross A. Lurgio Middle School, and Bedford High School.
Ownership History
Date
Name
Owned For
Owner Type
Purchase Details
Closed on
Sep 23, 2019
Sold by
Pihl Frederick R
Bought by
Frederick R Pihl Jr Ret
Current Estimated Value
Purchase Details
Closed on
Oct 3, 2018
Sold by
812 Financial Services
Bought by
Pihl Frederick R
Home Financials for this Owner
Home Financials are based on the most recent Mortgage that was taken out on this home.
Original Mortgage
$240,000
Interest Rate
4.5%
Mortgage Type
Purchase Money Mortgage
Purchase Details
Closed on
Sep 21, 2018
Sold by
Charron Michael J
Bought by
812 Financial Services
Home Financials for this Owner
Home Financials are based on the most recent Mortgage that was taken out on this home.
Original Mortgage
$240,000
Interest Rate
4.5%
Mortgage Type
Purchase Money Mortgage
Purchase Details
Closed on
Nov 2, 2017
Sold by
Maurice J Charron Ret
Bought by
Carron Michael J
Purchase Details
Closed on
Jun 14, 2012
Sold by
Charron Maurice J
Bought by
Maurice J Charron Ret and Charron Maurice J
Purchase Details
Closed on
Jan 10, 1990
Bought by
Maurice J Charron Ret
Create a Home Valuation Report for This Property
The Home Valuation Report is an in-depth analysis detailing your home's value as well as a comparison with similar homes in the area
Home Values in the Area
Average Home Value in this Area
Purchase History
| Date | Buyer | Sale Price | Title Company |
|---|---|---|---|
| Frederick R Pihl Jr Ret | -- | None Available | |
| Pihl Frederick R | $300,000 | -- | |
| 812 Financial Services | $240,000 | -- | |
| Carron Michael J | -- | -- | |
| Maurice J Charron Ret | -- | -- | |
| Maurice J Charron Ret | $4,000 | -- |
Source: Public Records
Mortgage History
| Date | Status | Borrower | Loan Amount |
|---|---|---|---|
| Previous Owner | Pihl Frederick R | $240,000 |
Source: Public Records
Tax History Compared to Growth
Tax History
| Year | Tax Paid | Tax Assessment Tax Assessment Total Assessment is a certain percentage of the fair market value that is determined by local assessors to be the total taxable value of land and additions on the property. | Land | Improvement |
|---|---|---|---|---|
| 2024 | $8,648 | $547,000 | $252,200 | $294,800 |
| 2023 | $8,096 | $547,000 | $252,200 | $294,800 |
| 2022 | $7,482 | $425,100 | $186,900 | $238,200 |
| 2021 | $6,815 | $397,600 | $186,900 | $210,700 |
| 2020 | $6,282 | $313,800 | $143,700 | $170,100 |
| 2019 | $5,947 | $313,800 | $143,700 | $170,100 |
| 2018 | $5,859 | $287,200 | $143,700 | $143,500 |
| 2017 | $5,431 | $287,200 | $143,700 | $143,500 |
| 2016 | $5,427 | $242,600 | $115,000 | $127,600 |
| 2015 | $5,522 | $242,600 | $115,000 | $127,600 |
| 2014 | $5,459 | $242,600 | $115,000 | $127,600 |
| 2013 | $5,378 | $242,600 | $115,000 | $127,600 |
Source: Public Records
Map
Nearby Homes
- 34 Chatham Dr
- 29 Pebble Beach Dr
- 15 Spyglass Point Cir
- 20 Pebble Beach Dr Unit 22-89-20
- 18 Horizon Dr
- 197 Liberty Hill Rd
- 769 Daniel Webster Hwy
- 4243 Brown Ave
- 10 Barrington Dr
- 4481 Brown Ave
- 12 Knoll Crest Dr Unit Lot 5 - The Hannah
- 4543 Brown Ave
- 82 Pilgrim Dr
- 67 Murphy St
- 145 Fox St
- 112 Riverdale Ave
- 67 Pullman St
- 116 Nashua Rd
- 7 Hamilton Way
- 32 Puritan Dr
- 85 Sandy Pond Pkwy
- 28 Sandy Pond Pkwy
- 81 Sandy Pond Pkwy
- 24 Sandy Pond Pkwy
- 36 Sandy Pond Pkwy
- 31 Sandy Pond Pkwy
- 27 Sandy Pond Pkwy
- 34-23-17 Sandy Pond Pkwy
- 35 Sandy Pond Pkwy
- 77 Sandy Pond Pkwy
- 20 Sandy Pond Pkwy
- 23 Sandy Pond Pkwy
- 39 Sandy Pond Pkwy
- 44 Sandy Pond Pkwy
- 82 Sebbins Pond Dr
- 15 Sandy Pond Pkwy
- 84 Sebbins Pond Dr
- 43 Sandy Pond Pkwy
- 80 Sebbins Pond Dr
- 37 Mulberry Ln