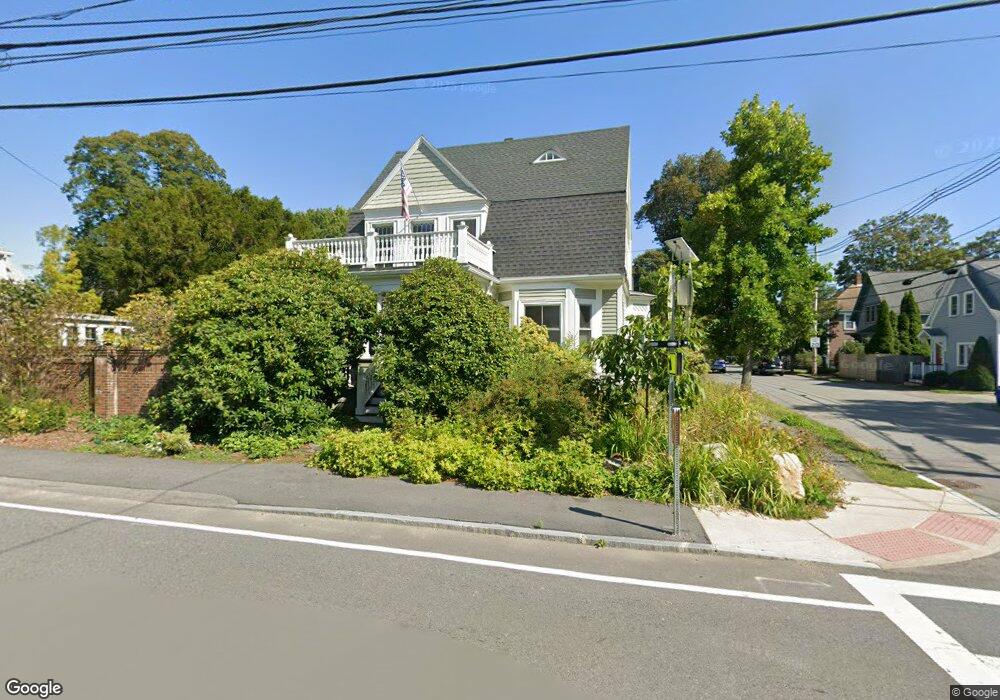
89 School St Manchester, MA 01944
Estimated Value: $1,124,000 - $1,702,000
3
Beds
2
Baths
2,691
Sq Ft
$499/Sq Ft
Est. Value
About This Home
This home is located at 89 School St, Manchester, MA 01944 and is currently estimated at $1,342,318, approximately $498 per square foot. 89 School St is a home located in Essex County with nearby schools including Manchester Essex Regional High School, Tara Montessori School, and Glen Urquhart School.
Ownership History
Date
Name
Owned For
Owner Type
Purchase Details
Closed on
Aug 25, 2015
Sold by
Bodmer-Turner Sandra J
Bought by
J H Hodmer Turner Ret
Current Estimated Value
Purchase Details
Closed on
Jul 1, 1999
Sold by
Lynch Marion L
Bought by
Bodmer Sandra Jean and Bodmer Harold Jeffrey
Create a Home Valuation Report for This Property
The Home Valuation Report is an in-depth analysis detailing your home's value as well as a comparison with similar homes in the area
Home Values in the Area
Average Home Value in this Area
Purchase History
We collect this data history from publicly available records. To have your information removed, we recommend requesting removal directly through your county’s website.
| Date | Buyer | Sale Price | Title Company |
|---|---|---|---|
| J H Hodmer Turner Ret | -- | -- | |
| Bodmer Sandra Jean | $460,000 | -- |
Source: Public Records
Mortgage History
We collect this data history from publicly available records. To have your information removed, we recommend requesting removal directly through your county’s website.
| Date | Status | Borrower | Loan Amount |
|---|---|---|---|
| Previous Owner | Bodmer Sandra Jean | $330,000 | |
| Previous Owner | Bodmer Sandra Jean | $165,000 | |
| Previous Owner | Bodmer Sandra Jean | $40,000 |
Source: Public Records
Tax History
| Year | Tax Paid | Tax Assessment Tax Assessment Total Assessment is a certain percentage of the fair market value that is determined by local assessors to be the total taxable value of land and additions on the property. | Land | Improvement |
|---|---|---|---|---|
| 2025 | $9,568 | $1,045,700 | $454,200 | $591,500 |
| 2024 | $9,186 | $982,500 | $437,900 | $544,600 |
| 2023 | $9,037 | $866,400 | $389,300 | $477,100 |
| 2022 | $8,587 | $810,100 | $356,800 | $453,300 |
| 2021 | $8,594 | $782,000 | $340,600 | $441,400 |
| 2020 | $8,846 | $756,100 | $324,400 | $431,700 |
| 2019 | $8,405 | $748,400 | $324,400 | $424,000 |
| 2018 | $8,255 | $748,400 | $324,400 | $424,000 |
| 2017 | $8,232 | $748,400 | $324,400 | $424,000 |
| 2016 | $7,972 | $720,100 | $324,400 | $395,700 |
| 2015 | $6,868 | $633,600 | $292,000 | $341,600 |
Source: Public Records
Map
Nearby Homes
Your Personal Tour Guide
Ask me questions while you tour the home.