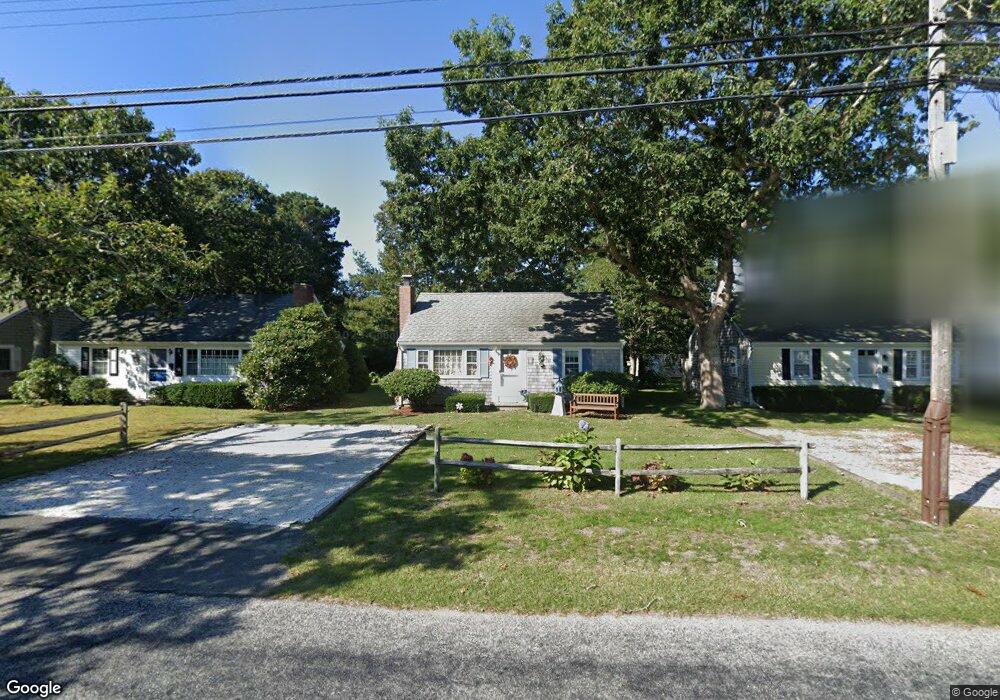
89 Seaview Ave South Yarmouth, MA 02664
Estimated Value: $483,000 - $574,278
2
Beds
1
Bath
800
Sq Ft
$652/Sq Ft
Est. Value
About This Home
This home is located at 89 Seaview Ave, South Yarmouth, MA 02664 and is currently estimated at $521,570, approximately $651 per square foot. 89 Seaview Ave is a home located in Barnstable County with nearby schools including Dennis-Yarmouth Regional High School, Sturgis Charter Public School, and St. Pius X. School.
Ownership History
Date
Name
Owned For
Owner Type
Purchase Details
Closed on
Jul 2, 2024
Sold by
Schnopp Gerald P and Schnopp Rosemary A
Bought by
Gerald P & R Schnopp Ret and Schnopp
Current Estimated Value
Purchase Details
Closed on
Sep 4, 2001
Sold by
Smarz David W and Smarz Michael E
Bought by
Schnopp Gerald P and Schnopp Rosemary A
Home Financials for this Owner
Home Financials are based on the most recent Mortgage that was taken out on this home.
Original Mortgage
$98,000
Interest Rate
7.06%
Mortgage Type
Purchase Money Mortgage
Purchase Details
Closed on
Jan 20, 1989
Sold by
Servos William
Bought by
Smarz David W
Home Financials for this Owner
Home Financials are based on the most recent Mortgage that was taken out on this home.
Original Mortgage
$100,000
Interest Rate
10.38%
Mortgage Type
Purchase Money Mortgage
Create a Home Valuation Report for This Property
The Home Valuation Report is an in-depth analysis detailing your home's value as well as a comparison with similar homes in the area
Home Values in the Area
Average Home Value in this Area
Purchase History
| Date | Buyer | Sale Price | Title Company |
|---|---|---|---|
| Gerald P & R Schnopp Ret | -- | None Available | |
| Gerald P & R Schnopp Ret | -- | None Available | |
| Schnopp Gerald P | $161,250 | -- | |
| Smarz David W | $130,200 | -- | |
| Schnopp Gerald P | $161,250 | -- | |
| Smarz David W | $130,200 | -- |
Source: Public Records
Mortgage History
| Date | Status | Borrower | Loan Amount |
|---|---|---|---|
| Previous Owner | Schnopp Gerald P | $98,000 | |
| Previous Owner | Smarz David W | $100,000 |
Source: Public Records
Tax History Compared to Growth
Tax History
| Year | Tax Paid | Tax Assessment Tax Assessment Total Assessment is a certain percentage of the fair market value that is determined by local assessors to be the total taxable value of land and additions on the property. | Land | Improvement |
|---|---|---|---|---|
| 2025 | $3,237 | $457,200 | $230,700 | $226,500 |
| 2024 | $3,017 | $408,800 | $200,600 | $208,200 |
| 2023 | $2,874 | $354,400 | $169,300 | $185,100 |
| 2022 | $2,748 | $299,300 | $151,500 | $147,800 |
| 2021 | $2,648 | $277,000 | $151,500 | $125,500 |
| 2020 | $0 | $253,800 | $149,100 | $104,700 |
| 2019 | $0 | $238,900 | $149,100 | $89,800 |
| 2018 | $2,368 | $230,100 | $140,300 | $89,800 |
| 2017 | $2,306 | $230,100 | $140,300 | $89,800 |
| 2016 | $2,270 | $227,500 | $140,300 | $87,200 |
| 2015 | -- | $216,500 | $140,300 | $76,200 |
Source: Public Records
Map
Nearby Homes
- 55 Aspinet Rd
- 109 Seaview Ave Unit 11
- 55 Pawkannawkut Dr
- 26 Howes Rd
- 30 Nauset Ln
- 21 Lyndale Rd
- 8 Holly Ln
- 135 S South Shore Dr Unit 17
- 135 S Shore Dr Unit 17
- 8 Rogers Ave
- 16 Peregrine Ln
- 31 Gardiner Ln
- 27 Wilfin Rd
- 844 Route 28 Unit 1C
- 844 Route 28 Unit 1C
- 844 Route 28 Unit 9B
- 89 Acres Ave
- 2 Sachem Path
- 9 Cedar St
- 91 Seaview Ave
- 87 Seaview Ave
- 90 Seaview U#18q Ave
- 93 Seaview Ave
- 83 Seaview Ave
- 54 Aspinet Rd
- 95 Seaview Ave
- 81 Seaview Ave
- 48 Aspinet Rd
- 99 Seaview Ave
- 90 Seaview Ave Unit 24W
- 90 Seaview Ave Unit 23V
- 90 Seaview Ave Unit 22U
- 90 Seaview Ave Unit 21T
- 90 Seaview Ave Unit 20S
- 90 Seaview Ave Unit 19R
- 90 Seaview Ave Unit 18Q
- 90 Seaview Ave Unit 17P
- 90 Seaview Ave Unit 16O
- 90 Seaview Ave Unit 15O