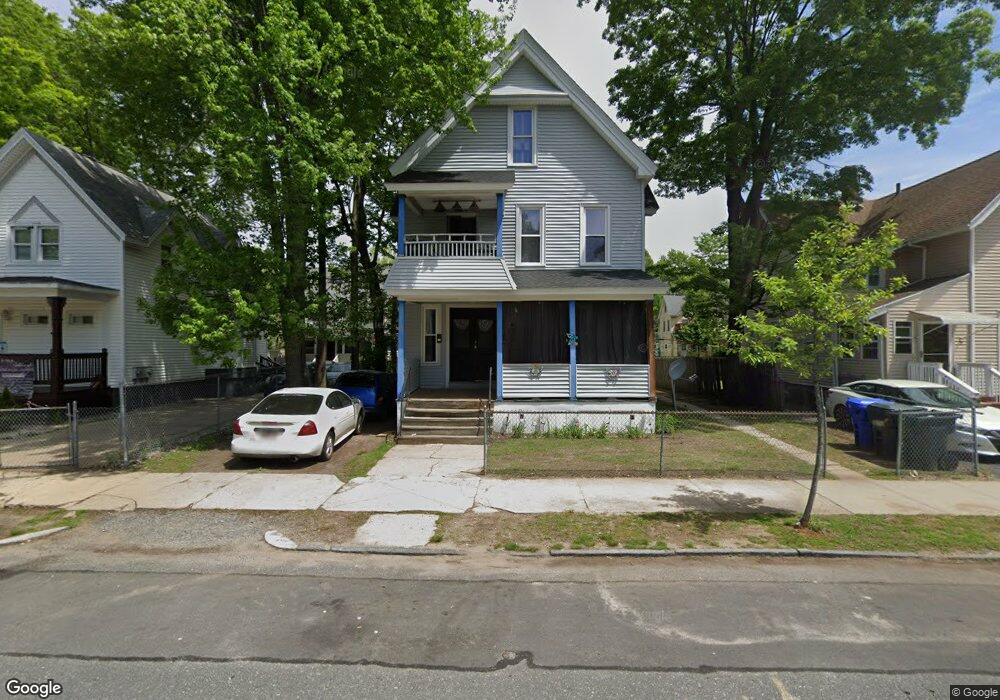
89 Sherman St Springfield, MA 01109
McKnight NeighborhoodEstimated Value: $251,388 - $473,000
7
Beds
3
Baths
2,792
Sq Ft
$123/Sq Ft
Est. Value
About This Home
This home is located at 89 Sherman St, Springfield, MA 01109 and is currently estimated at $343,847, approximately $123 per square foot. 89 Sherman St is a home located in Hampden County with nearby schools including Rebecca M Johnson School, Van Sickle Academy, and High School Of Commerce.
Ownership History
Date
Name
Owned For
Owner Type
Purchase Details
Closed on
Mar 31, 2022
Sold by
Springfield Homes Llc
Bought by
Yellowbrick Property Llc
Current Estimated Value
Home Financials for this Owner
Home Financials are based on the most recent Mortgage that was taken out on this home.
Original Mortgage
$2,130,555
Outstanding Balance
$2,009,896
Interest Rate
4.67%
Mortgage Type
Stand Alone Refi Refinance Of Original Loan
Estimated Equity
-$1,666,049
Purchase Details
Closed on
Feb 11, 1987
Sold by
Fountain Rt
Bought by
Home City Housing Dev
Create a Home Valuation Report for This Property
The Home Valuation Report is an in-depth analysis detailing your home's value as well as a comparison with similar homes in the area
Home Values in the Area
Average Home Value in this Area
Purchase History
| Date | Buyer | Sale Price | Title Company |
|---|---|---|---|
| Yellowbrick Property Llc | -- | None Available | |
| Home City Housing Dev | $32,000 | -- |
Source: Public Records
Mortgage History
| Date | Status | Borrower | Loan Amount |
|---|---|---|---|
| Open | Yellowbrick Property Llc | $2,130,555 |
Source: Public Records
Tax History
| Year | Tax Paid | Tax Assessment Tax Assessment Total Assessment is a certain percentage of the fair market value that is determined by local assessors to be the total taxable value of land and additions on the property. | Land | Improvement |
|---|---|---|---|---|
| 2025 | $2,935 | $187,200 | $25,500 | $161,700 |
| 2024 | $2,677 | $166,700 | $23,900 | $142,800 |
| 2023 | $3,021 | $177,200 | $22,700 | $154,500 |
| 2022 | $3,098 | $164,600 | $20,700 | $143,900 |
| 2021 | $2,875 | $152,100 | $18,800 | $133,300 |
| 2020 | $2,472 | $126,600 | $18,800 | $107,800 |
| 2019 | $2,391 | $121,500 | $16,000 | $105,500 |
| 2018 | $2,295 | $116,600 | $16,000 | $100,600 |
| 2017 | $2,288 | $116,400 | $15,100 | $101,300 |
| 2016 | $2,286 | $116,300 | $15,100 | $101,200 |
| 2015 | $2,262 | $115,000 | $15,100 | $99,900 |
Source: Public Records
Map
Nearby Homes
- 158 Bowles St
- 22-24 Westminster St
- 163 Marion St
- 123 Bay St
- 52-56 Andrew St
- 166 Westminster St
- 41 Florida St
- 16 Amherst St
- 63 Bay St
- 65 Montrose St
- 145 Cambridge St
- 107 Dartmouth St
- 46 Mapledell St
- 290 Quincy St
- 16 Cambridge St
- 21 Clifford St
- 15 Kenyon St
- 118 Quincy St
- 19 Westford Ave
- 106 Amherst St
- 85 Sherman St
- 91 Sherman St
- 79 Sherman St
- 75 Sherman St
- 75-79 Sherman St
- 94 Catharine St
- 75-79R Sherman Reet
- 98 Catharine St
- 84 Catharine St
- 73 Sherman St
- 107 Sherman St
- 78 Catharine St Unit 80
- 86 Sherman St
- 69 Sherman St
- 21 Mcknight St
- 94 Sherman St Unit 96
- 74 Catharine St
- 80 Sherman St
- 0 (NS) Mcknight St
- 74 Sherman St
Your Personal Tour Guide
Ask me questions while you tour the home.