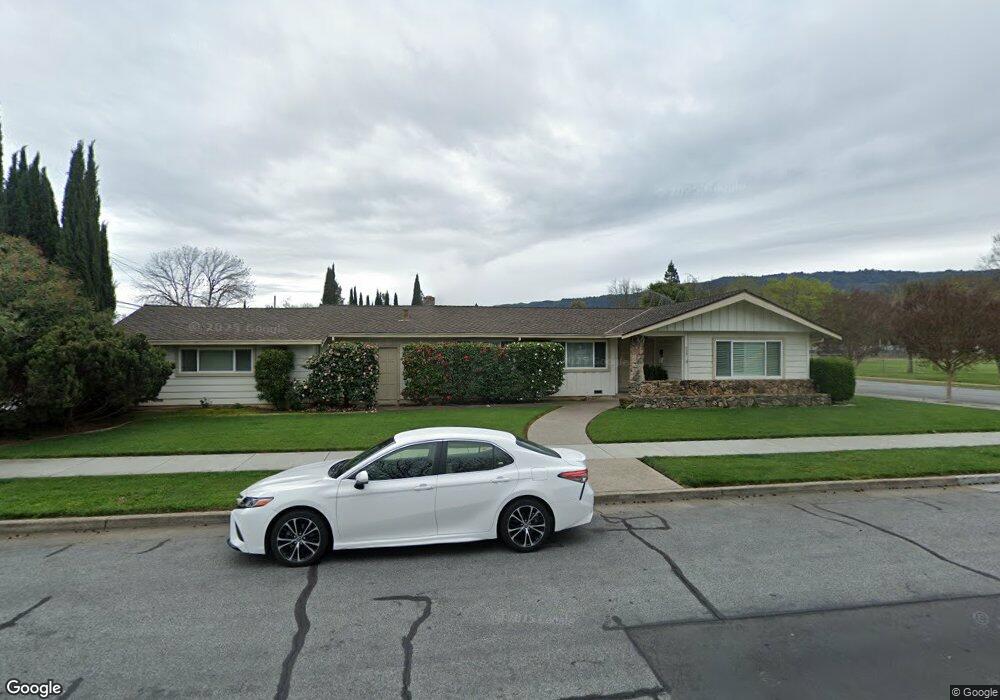
890 4th St Gilroy, CA 95020
Estimated Value: $638,000 - $1,072,240
3
Beds
2
Baths
2,063
Sq Ft
$448/Sq Ft
Est. Value
About This Home
This home is located at 890 4th St, Gilroy, CA 95020 and is currently estimated at $923,310, approximately $447 per square foot. 890 4th St is a home located in Santa Clara County with nearby schools including El Roble Elementary School, Brownell Middle School, and Solorsano Middle School.
Ownership History
Date
Name
Owned For
Owner Type
Purchase Details
Closed on
Dec 1, 2020
Sold by
Filice Michael J
Bought by
Frantzich Linda T
Current Estimated Value
Purchase Details
Closed on
Nov 20, 2020
Sold by
Filice David B
Bought by
Frantzich Linda T
Purchase Details
Closed on
Aug 3, 2020
Sold by
Frantzich Linda T and Filice Michael J
Bought by
Frantzich Mark A and Frantzich Linda
Home Financials for this Owner
Home Financials are based on the most recent Mortgage that was taken out on this home.
Original Mortgage
$569,500
Interest Rate
3%
Mortgage Type
New Conventional
Purchase Details
Closed on
Jun 5, 2020
Sold by
Frantzich Linda T and 2008 Marlene A
Bought by
Frantzich Linda T and Filice Michael J
Home Financials for this Owner
Home Financials are based on the most recent Mortgage that was taken out on this home.
Original Mortgage
$569,500
Interest Rate
3%
Mortgage Type
New Conventional
Purchase Details
Closed on
Feb 13, 2008
Sold by
Filice Marlene A
Bought by
Filice Marlene A
Create a Home Valuation Report for This Property
The Home Valuation Report is an in-depth analysis detailing your home's value as well as a comparison with similar homes in the area
Home Values in the Area
Average Home Value in this Area
Purchase History
| Date | Buyer | Sale Price | Title Company |
|---|---|---|---|
| Frantzich Linda T | $372,000 | None Listed On Document | |
| Frantzich Linda T | $372,000 | None Listed On Document | |
| Frantzich Mark A | $47,500 | Old Republic Title | |
| Frantzich Linda T | -- | Old Republic Title | |
| Filice Marlene A | -- | None Available |
Source: Public Records
Mortgage History
| Date | Status | Borrower | Loan Amount |
|---|---|---|---|
| Previous Owner | Frantzich Mark A | $569,500 |
Source: Public Records
Tax History
| Year | Tax Paid | Tax Assessment Tax Assessment Total Assessment is a certain percentage of the fair market value that is determined by local assessors to be the total taxable value of land and additions on the property. | Land | Improvement |
|---|---|---|---|---|
| 2025 | $5,865 | $477,399 | $246,891 | $230,508 |
| 2024 | $5,865 | $468,039 | $242,050 | $225,989 |
| 2023 | $5,830 | $458,862 | $237,304 | $221,558 |
| 2022 | $5,734 | $449,865 | $232,651 | $217,214 |
| 2021 | $1,167 | $82,116 | $16,193 | $65,923 |
| 2020 | $999 | $81,275 | $16,027 | $65,248 |
| 2019 | $988 | $79,682 | $15,713 | $63,969 |
| 2018 | $924 | $78,120 | $15,405 | $62,715 |
| 2017 | $941 | $76,589 | $15,103 | $61,486 |
| 2016 | $911 | $75,088 | $14,807 | $60,281 |
| 2015 | $861 | $73,961 | $14,585 | $59,376 |
| 2014 | $912 | $72,513 | $14,300 | $58,213 |
Source: Public Records
Map
Nearby Homes
- 7490 Santa Theresa Dr Unit 10
- 925 Blake Ct
- 7460 Miller Ave
- 60 Monte Vista Way
- 751 W 6th St
- 7821 Santa Theresa Dr
- 7609 Santa Paula Dr
- 7384 Ailes Ct
- 7376 Ailes Ct
- 7360 Ailes Ct
- 6389 Tawhana Ln
- 7352 Ailes Ct Unit Homesite 7
- 7351 Princevalle St Unit Homesite 18
- Plan 2 at Heritage on 6th Street
- Plan 1 at Heritage on 6th Street
- 7681 Hanna St
- 7630 Hanna St
- 7310 Carmel St
- 622 Broadway
- 620 Broadway
- 7580 Santa Theresa Dr
- 7570 Santa Theresa Dr
- 7591 Filice Dr
- 6th Santa Theresa Dr
- 899 4th St
- 7581 Filice Dr
- 7571 Filice Dr
- 7560 Santa Theresa Dr
- 7601 Filice Dr
- 7610 Santa Theresa Dr
- 7561 Filice Dr
- 7550 Santa Theresa Dr
- 7621 Filice Dr
- 7620 Santa Theresa Dr
- 7551 Filice Dr
- 7565 Santa Theresa Dr
- 840 4th St
- 7580 Filice Dr
- 7540 Santa Theresa Dr
- 7631 Filice Dr
Your Personal Tour Guide
Ask me questions while you tour the home.