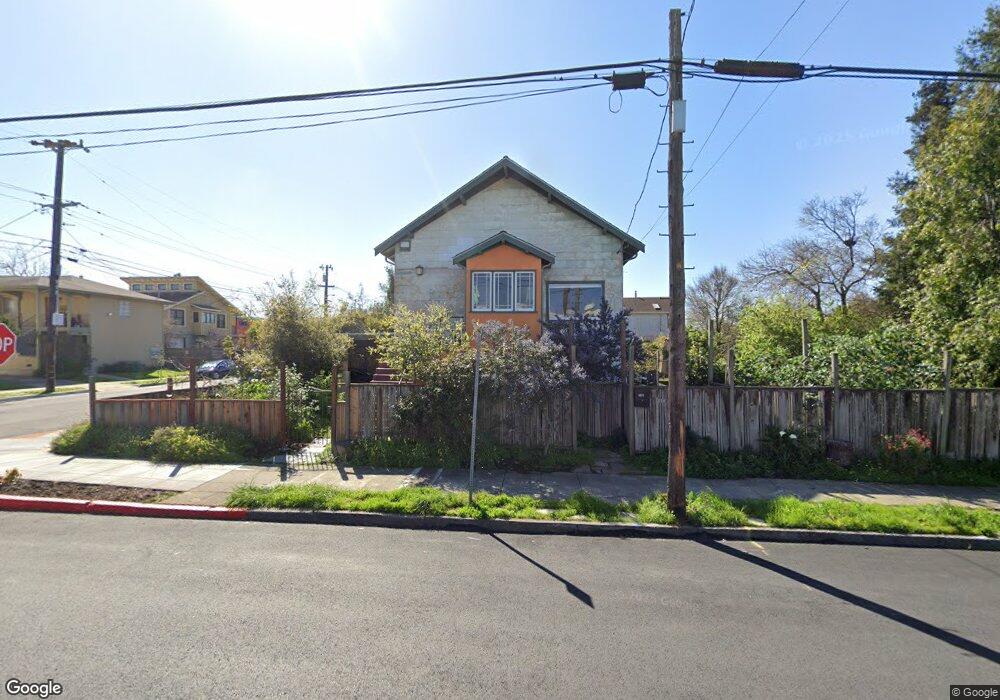
890 Camelia St Berkeley, CA 94710
West Berkeley NeighborhoodEstimated Value: $1,246,000 - $1,406,000
3
Beds
1
Bath
706
Sq Ft
$1,845/Sq Ft
Est. Value
About This Home
This home is located at 890 Camelia St, Berkeley, CA 94710 and is currently estimated at $1,302,491, approximately $1,844 per square foot. 890 Camelia St is a home located in Alameda County with nearby schools including Rosa Parks Elementary School, Ruth Acty Elementary, and Berkeley Arts Magnet at Whittier School.
Ownership History
Date
Name
Owned For
Owner Type
Purchase Details
Closed on
Feb 1, 2025
Sold by
Cox Paul E and Schueler Margo
Bought by
Paul Eugene Cox And Margo Schueler Revocable
Current Estimated Value
Purchase Details
Closed on
Sep 13, 1994
Sold by
Littlefield Christiana Richard T and Littlefield Laughlin Ellen Colleen
Bought by
Cox Paul E and Schueler Margo
Home Financials for this Owner
Home Financials are based on the most recent Mortgage that was taken out on this home.
Original Mortgage
$176,000
Interest Rate
6%
Create a Home Valuation Report for This Property
The Home Valuation Report is an in-depth analysis detailing your home's value as well as a comparison with similar homes in the area
Home Values in the Area
Average Home Value in this Area
Purchase History
| Date | Buyer | Sale Price | Title Company |
|---|---|---|---|
| Paul Eugene Cox And Margo Schueler Revocable | -- | None Listed On Document | |
| Cox Paul E | $220,000 | Northwestern Title Company |
Source: Public Records
Mortgage History
| Date | Status | Borrower | Loan Amount |
|---|---|---|---|
| Previous Owner | Cox Paul E | $176,000 |
Source: Public Records
Tax History
| Year | Tax Paid | Tax Assessment Tax Assessment Total Assessment is a certain percentage of the fair market value that is determined by local assessors to be the total taxable value of land and additions on the property. | Land | Improvement |
|---|---|---|---|---|
| 2025 | $8,964 | $362,513 | $110,854 | $258,659 |
| 2024 | $8,964 | $355,268 | $108,680 | $253,588 |
| 2023 | $8,668 | $355,167 | $106,550 | $248,617 |
| 2022 | $8,366 | $341,204 | $104,461 | $243,743 |
| 2021 | $8,332 | $334,377 | $102,413 | $238,964 |
| 2020 | $7,756 | $337,877 | $101,363 | $236,514 |
| 2019 | $7,298 | $331,253 | $99,376 | $231,877 |
| 2018 | $7,094 | $324,758 | $97,427 | $227,331 |
| 2017 | $7,022 | $318,391 | $95,517 | $222,874 |
| 2016 | $6,681 | $312,150 | $93,645 | $218,505 |
| 2015 | $6,560 | $307,462 | $92,238 | $215,224 |
| 2014 | $6,232 | $301,441 | $90,432 | $211,009 |
Source: Public Records
Map
Nearby Homes
- 817 Jones St
- 0 Camelia St Unit 41104882
- 1504 10th St
- 1339 Kains Ave
- 995 Virginia St
- 1729 8th St
- 817 Delaware St
- 940 Delaware St
- 1050 Kains Ave Unit B1(3)
- 1114 Talbot Ave
- 1631 Belvedere Ave
- 1728 Curtis St
- 1128 Delaware St
- 1136 Marin Ave
- 1127 Key Route Blvd
- 986 Kains Ave
- 2010 9th St
- 1322 Virginia St
- 2013 9th St
- 1120 Curtis St
Your Personal Tour Guide
Ask me questions while you tour the home.