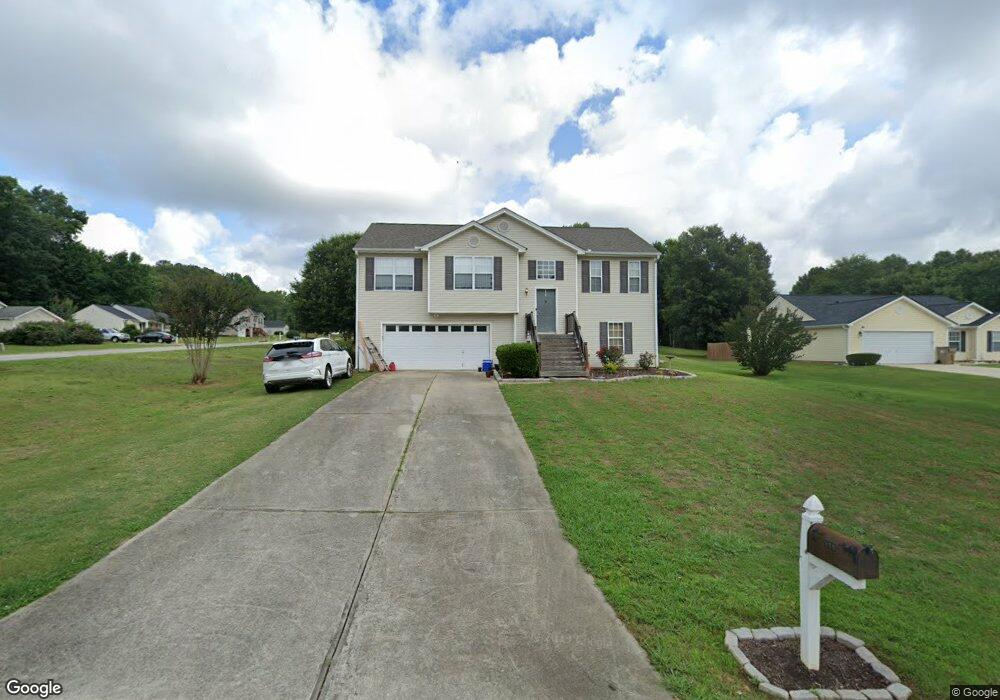
890 Dustin Ct Bethlehem, GA 30620
Estimated Value: $272,569 - $298,000
3
Beds
2
Baths
1,249
Sq Ft
$225/Sq Ft
Est. Value
About This Home
This home is located at 890 Dustin Ct, Bethlehem, GA 30620 and is currently estimated at $280,642, approximately $224 per square foot. 890 Dustin Ct is a home located in Barrow County with nearby schools including Bethlehem Elementary School, Haymon-Morris Middle School, and Apalachee High School.
Ownership History
Date
Name
Owned For
Owner Type
Purchase Details
Closed on
Aug 30, 2011
Sold by
Arch Bay Holdings Llc
Bought by
Steed Austin
Current Estimated Value
Home Financials for this Owner
Home Financials are based on the most recent Mortgage that was taken out on this home.
Original Mortgage
$75,647
Outstanding Balance
$52,148
Interest Rate
4.4%
Mortgage Type
New Conventional
Estimated Equity
$228,494
Purchase Details
Closed on
Apr 5, 2011
Sold by
Reynolds Robert
Bought by
Arch Bay Holdings Llc 2010A
Purchase Details
Closed on
Nov 21, 2002
Sold by
Star Home Builders
Bought by
Reynolds Robert
Home Financials for this Owner
Home Financials are based on the most recent Mortgage that was taken out on this home.
Original Mortgage
$104,650
Interest Rate
6.3%
Mortgage Type
New Conventional
Purchase Details
Closed on
Apr 12, 2002
Sold by
Casta Development In
Bought by
Star Home Builders I
Purchase Details
Closed on
Dec 4, 2000
Bought by
Casta Development In
Create a Home Valuation Report for This Property
The Home Valuation Report is an in-depth analysis detailing your home's value as well as a comparison with similar homes in the area
Home Values in the Area
Average Home Value in this Area
Purchase History
| Date | Buyer | Sale Price | Title Company |
|---|---|---|---|
| Steed Austin | $70,000 | -- | |
| Arch Bay Holdings Llc 2010A | $75,000 | -- | |
| Arch Bay Holdings Llc | -- | -- | |
| Reynolds Robert | $110,200 | -- | |
| Star Home Builders I | $27,000 | -- | |
| Casta Development In | -- | -- |
Source: Public Records
Mortgage History
| Date | Status | Borrower | Loan Amount |
|---|---|---|---|
| Open | Steed Austin | $75,647 | |
| Previous Owner | Reynolds Robert | $104,650 |
Source: Public Records
Tax History Compared to Growth
Tax History
| Year | Tax Paid | Tax Assessment Tax Assessment Total Assessment is a certain percentage of the fair market value that is determined by local assessors to be the total taxable value of land and additions on the property. | Land | Improvement |
|---|---|---|---|---|
| 2024 | $2,077 | $84,648 | $19,200 | $65,448 |
| 2023 | $1,671 | $85,048 | $19,200 | $65,848 |
| 2022 | $1,962 | $69,549 | $19,200 | $50,349 |
| 2021 | $1,720 | $58,024 | $16,000 | $42,024 |
| 2020 | $1,720 | $58,024 | $16,000 | $42,024 |
| 2019 | $1,749 | $58,024 | $16,000 | $42,024 |
| 2018 | $1,603 | $54,024 | $12,000 | $42,024 |
| 2017 | $1,105 | $37,955 | $12,000 | $25,955 |
| 2016 | $1,087 | $37,955 | $12,000 | $25,955 |
| 2015 | $1,102 | $38,246 | $12,000 | $26,246 |
| 2014 | $926 | $32,416 | $5,880 | $26,536 |
| 2013 | -- | $31,126 | $5,880 | $25,246 |
Source: Public Records
Map
Nearby Homes
- 303 Carly Ct
- 164 Manning Gin Rd
- 1235 Dale Dr
- 1408 Wyndham Way
- 1050 Bethlehem Church Rd
- 0 McElhannon Rd SW Unit 10581793
- 784 Manger Ave
- 3300 Jack Glass Rd
- 966 David Ave
- 0 Manger Ave E Unit 20154677
- 0 Manger Ave E Unit 20127001
- 724 Manger Ave
- 797 Ode Peppers Rd
- 449 & 455 Carl-Bethlehem Rd
- 1224 Palmer Dr
- 898 Harrison Mill Rd
- 2796 Barbon Rd
- 633 Skyland Dr
- 1217 Cabin Bridge Rd
- 1210 Austin Rd
- 892 Dustin Ct
- 892 Dustin Ct Unit 39
- 0 Dustin Ct Unit 8036792
- 0 Dustin Ct Unit 3175674
- 0 Dustin Ct Unit 8578415
- 0 Dustin Ct Unit 7143921
- 0 Dustin Ct Unit 7021100
- 0 Dustin Ct
- 894 Dustin Ct
- 1477 Elise Dr
- 771 Samuel Ct
- 1479 Elise Dr
- 773 Samuel Ct
- 773 Samuel Ct Unit 1
- 1475 Elise Dr
- 1481 Elise Dr
- 891 Dustin Ct
- 893 Dustin Ct
- 775 Samuel Ct Unit 35
- 775 Samuel Ct