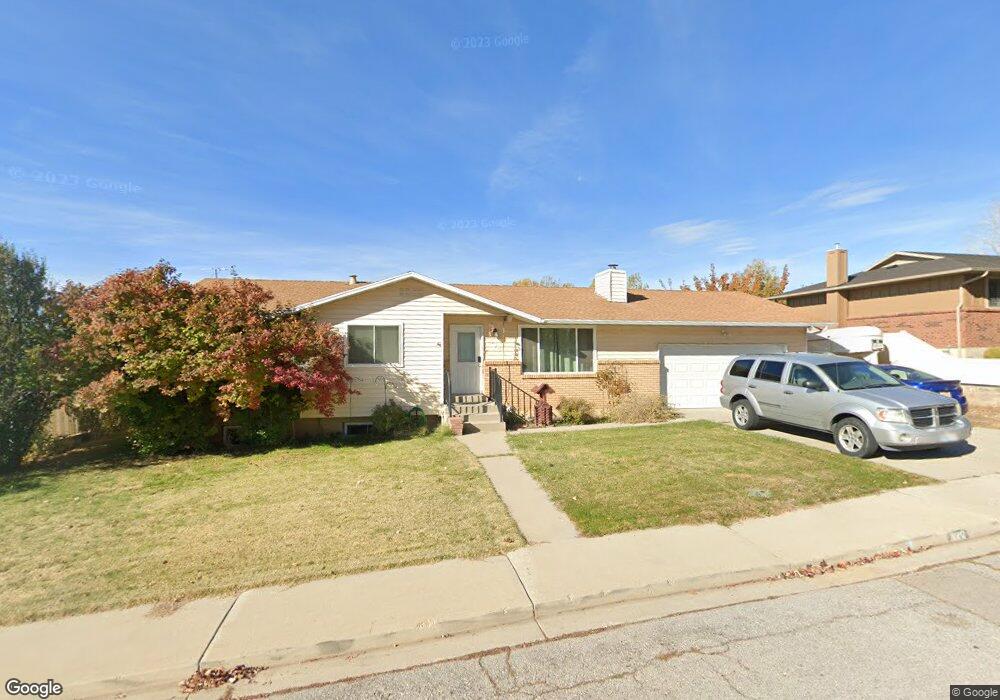
890 S 1600 E Pleasant Grove, UT 84062
Estimated Value: $516,000 - $549,000
3
Beds
2
Baths
1,214
Sq Ft
$439/Sq Ft
Est. Value
About This Home
This home is located at 890 S 1600 E, Pleasant Grove, UT 84062 and is currently estimated at $532,641, approximately $438 per square foot. 890 S 1600 E is a home located in Utah County with nearby schools including Valley View Elementary, Central Elementary School, and Oak Canyon Junior High School.
Ownership History
Date
Name
Owned For
Owner Type
Purchase Details
Closed on
Mar 3, 2025
Sold by
Rasmussen Ella Pauline and Naylor Jordan Makiel
Bought by
Ella Pauline Rasmussen Living Trust and Rasmussen
Current Estimated Value
Purchase Details
Closed on
Nov 9, 2022
Sold by
Rasmussen Ella Pauline
Bought by
Rasmussen Ella Pauline and Naylor Jordan Makiel
Purchase Details
Closed on
Apr 6, 2021
Sold by
Rasmussen E Pauline
Bought by
Rasmussen Ella Pauline
Home Financials for this Owner
Home Financials are based on the most recent Mortgage that was taken out on this home.
Original Mortgage
$128,000
Interest Rate
2.8%
Mortgage Type
New Conventional
Purchase Details
Closed on
Apr 1, 2021
Sold by
Rasmussen E Pauline
Bought by
Rasmussen Ella Pauline
Home Financials for this Owner
Home Financials are based on the most recent Mortgage that was taken out on this home.
Original Mortgage
$128,000
Interest Rate
2.8%
Mortgage Type
New Conventional
Purchase Details
Closed on
Oct 31, 1997
Sold by
Rasmussen Val D and Rasmussen Pauline
Bought by
Rasmussen Val D and Pauline Rasmussen E
Home Financials for this Owner
Home Financials are based on the most recent Mortgage that was taken out on this home.
Original Mortgage
$37,655
Interest Rate
7.26%
Create a Home Valuation Report for This Property
The Home Valuation Report is an in-depth analysis detailing your home's value as well as a comparison with similar homes in the area
Home Values in the Area
Average Home Value in this Area
Purchase History
| Date | Buyer | Sale Price | Title Company |
|---|---|---|---|
| Ella Pauline Rasmussen Living Trust | -- | None Listed On Document | |
| Rasmussen Ella Pauline | -- | None Listed On Document | |
| Rasmussen Ella Pauline | -- | Vanguard Title | |
| Rasmussen Ella Pauline | -- | Vanguard Title Insurance Age | |
| Rasmussen Val D | -- | Inwest Title Services Inc |
Source: Public Records
Mortgage History
| Date | Status | Borrower | Loan Amount |
|---|---|---|---|
| Previous Owner | Rasmussen Ella Pauline | $128,000 | |
| Previous Owner | Rasmussen Ella Pauline | $128,000 | |
| Previous Owner | Rasmussen Val D | $37,655 |
Source: Public Records
Tax History Compared to Growth
Tax History
| Year | Tax Paid | Tax Assessment Tax Assessment Total Assessment is a certain percentage of the fair market value that is determined by local assessors to be the total taxable value of land and additions on the property. | Land | Improvement |
|---|---|---|---|---|
| 2025 | $1,974 | $254,815 | $214,000 | $249,300 |
| 2024 | $1,974 | $235,620 | $0 | $0 |
| 2023 | $1,942 | $237,270 | $0 | $0 |
| 2022 | $2,054 | $249,645 | $0 | $0 |
| 2021 | $1,784 | $330,200 | $134,400 | $195,800 |
| 2020 | $1,633 | $296,400 | $120,000 | $176,400 |
| 2019 | $1,504 | $282,200 | $105,800 | $176,400 |
| 2018 | $1,450 | $257,300 | $98,800 | $158,500 |
| 2017 | $1,335 | $126,115 | $0 | $0 |
| 2016 | $1,323 | $120,615 | $0 | $0 |
| 2015 | $1,228 | $106,040 | $0 | $0 |
| 2014 | $1,222 | $104,500 | $0 | $0 |
Source: Public Records
Map
Nearby Homes
- 935 S 1500 E
- 745 S 1500 St E
- 897 Cherokee Dr
- 1515 E 720 S
- 650 S 1600 E
- 521 S 1660 E
- 1172 E Murdock Dr
- 778 S 1100 E
- 286 S 1150 E
- 177 S 1150 E
- 10 S 1400 E
- 405 N 150 E
- 630 S Loader Dr
- Prelude Plan at Blossom Hill
- Treble Plan at Blossom Hill
- Browning Plan at Blossom Hill
- Cantata Plan at Blossom Hill
- 176 S 1150 E
- Accord Plan at Blossom Hill
- Canon Plan at Blossom Hill