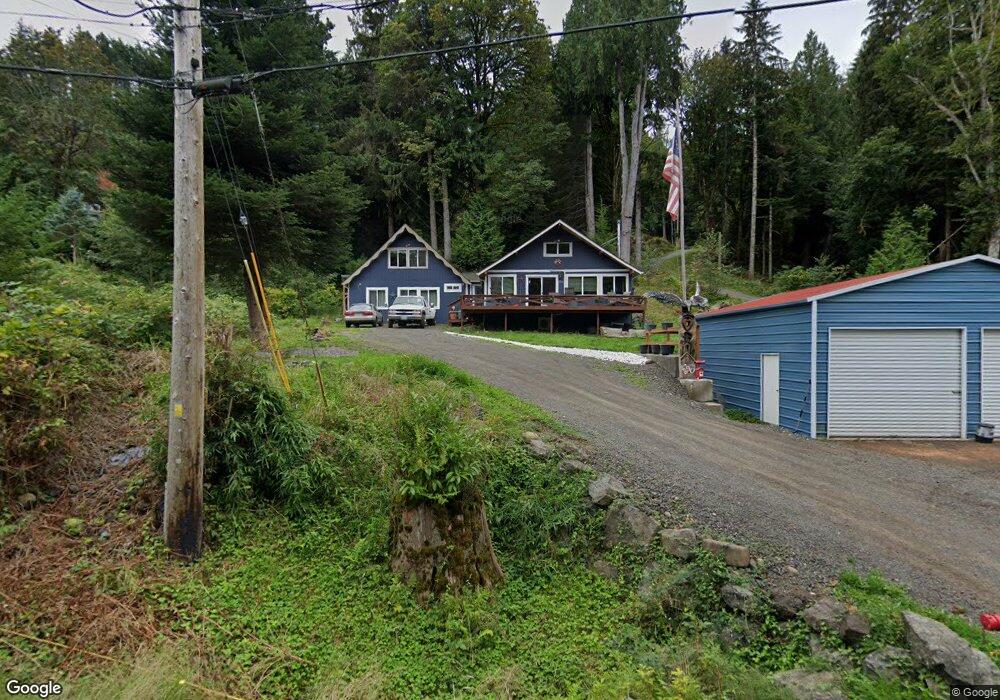
890 Seabeck Holly Rd W Seabeck, WA 98380
Estimated Value: $425,959 - $524,000
2
Beds
1
Bath
784
Sq Ft
$619/Sq Ft
Est. Value
About This Home
This home is located at 890 Seabeck Holly Rd W, Seabeck, WA 98380 and is currently estimated at $485,490, approximately $619 per square foot. 890 Seabeck Holly Rd W is a home located in Kitsap County with nearby schools including Green Mountain Elementary School and Klahowya Secondary School.
Ownership History
Date
Name
Owned For
Owner Type
Purchase Details
Closed on
Dec 10, 2016
Sold by
Merz Robert and Merz Robby
Bought by
Merz Bobby
Current Estimated Value
Home Financials for this Owner
Home Financials are based on the most recent Mortgage that was taken out on this home.
Original Mortgage
$207,570
Outstanding Balance
$167,426
Interest Rate
3.57%
Mortgage Type
FHA
Estimated Equity
$318,064
Purchase Details
Closed on
Mar 13, 2015
Sold by
Johnson Kay M
Bought by
Merz Robert
Home Financials for this Owner
Home Financials are based on the most recent Mortgage that was taken out on this home.
Original Mortgage
$164,400
Interest Rate
3.54%
Mortgage Type
New Conventional
Purchase Details
Closed on
Mar 21, 2013
Sold by
Johnson Kay
Bought by
Johnson Kay M and The Johnson Living Trust
Create a Home Valuation Report for This Property
The Home Valuation Report is an in-depth analysis detailing your home's value as well as a comparison with similar homes in the area
Home Values in the Area
Average Home Value in this Area
Purchase History
| Date | Buyer | Sale Price | Title Company |
|---|---|---|---|
| Merz Bobby | -- | None Available | |
| Merz Robert | $205,500 | Pacific Nw Title | |
| Johnson Kay M | -- | None Available |
Source: Public Records
Mortgage History
| Date | Status | Borrower | Loan Amount |
|---|---|---|---|
| Open | Merz Bobby | $207,570 | |
| Closed | Merz Robert | $164,400 |
Source: Public Records
Tax History Compared to Growth
Tax History
| Year | Tax Paid | Tax Assessment Tax Assessment Total Assessment is a certain percentage of the fair market value that is determined by local assessors to be the total taxable value of land and additions on the property. | Land | Improvement |
|---|---|---|---|---|
| 2026 | $3,153 | $328,070 | $66,990 | $261,080 |
| 2025 | $3,153 | $328,070 | $66,990 | $261,080 |
| 2024 | $3,067 | $328,070 | $66,990 | $261,080 |
| 2023 | $2,460 | $259,240 | $91,510 | $167,730 |
| 2022 | $2,394 | $222,420 | $73,310 | $149,110 |
| 2021 | $2,175 | $191,710 | $58,650 | $133,060 |
| 2020 | $2,060 | $183,530 | $55,610 | $127,920 |
| 2019 | $1,993 | $171,980 | $55,610 | $116,370 |
| 2018 | $2,156 | $160,390 | $56,900 | $103,490 |
| 2017 | $2,114 | $160,390 | $56,900 | $103,490 |
| 2016 | $1,983 | $138,920 | $49,480 | $89,440 |
| 2015 | $1,901 | $138,920 | $49,480 | $89,440 |
| 2014 | -- | $136,840 | $49,480 | $87,360 |
| 2013 | -- | $136,840 | $49,480 | $87,360 |
Source: Public Records
Map
Nearby Homes
- 22779 NW Seabeck Holly Rd
- 280 N Will Webb Rd
- 340 N Seagull Way
- 50 N Rustic Ridge Dr
- 310 N Beacon Point Loop S
- 80 N Beacon Point Loop S
- 560 N Beacon Point Loop N
- 20 N Triton Head Dr
- 680 N Triton Heights Rd
- 0 XXX N Triton Heights Rd
- 126 Handley Ln
- 0 NE Tahuya Blacksmith Unit NWM2389298
- 0 Maple Ave
- 11 Williams Ct
- 111 N Jorstad Creek Rd
- 91 N Hood View Place
- 221 N Trail Head Loop
- 670 Mallard Ln NW
- 211 N Hamma Ridge Dr
- 31 Hood Place
- 878 Seabeck Holly Rd W
- 0 6.7Acres Seabeck Holly Rd W
- 0 XXX Seabeck Holly Rd W
- 866 Seabeck Holly Rd W
- 24746 W Holly View Dr
- 24698 W Holly View Dr
- 848 Seabeck Holly Rd W
- 24688 W Holly View Dr
- 861 Seabeck Holly Rd W
- 24674 W Holly View Dr
- 820 Seabeck Holly Rd W
- 0 Parcel A Seabeck - Holly Rd
- 24672 W Holly View Dr
- 831 Seabeck Holly Rd W
- 999 Seabeck Holly Rd NW
- 879 Seabeck Holly Rd W
- 873 Seabeck Holly Rd W
- 885 Seabeck Holly Rd W
- 796 Seabeck Holly Rd W
- 24644 W Holly View Dr