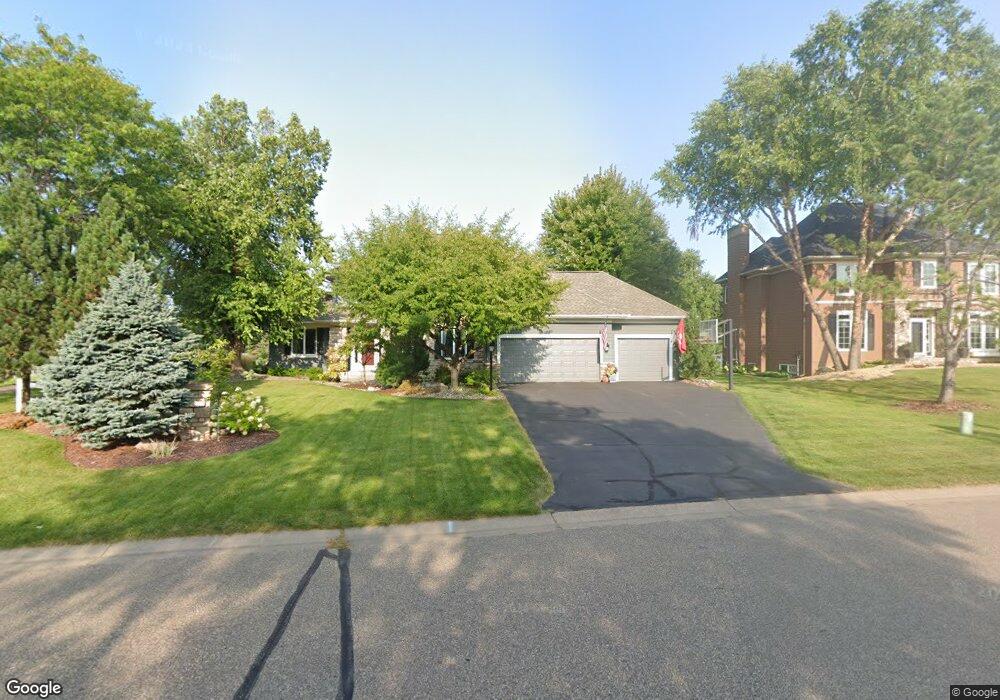
8900 Highview Ln Woodbury, MN 55125
Estimated Value: $845,399 - $919,000
5
Beds
4
Baths
4,298
Sq Ft
$208/Sq Ft
Est. Value
About This Home
This home is located at 8900 Highview Ln, Woodbury, MN 55125 and is currently estimated at $895,350, approximately $208 per square foot. 8900 Highview Ln is a home located in Washington County with nearby schools including Middleton Elementary School, Lake Middle School, and East Ridge High School.
Ownership History
Date
Name
Owned For
Owner Type
Purchase Details
Closed on
Aug 23, 2021
Sold by
Majewski Mark D and Majewski Michelle A
Bought by
Rulland Jeff T and Rulland Kathleen M
Current Estimated Value
Home Financials for this Owner
Home Financials are based on the most recent Mortgage that was taken out on this home.
Original Mortgage
$709,800
Outstanding Balance
$643,473
Interest Rate
2.7%
Mortgage Type
VA
Estimated Equity
$251,877
Purchase Details
Closed on
Dec 16, 2015
Sold by
Majewski Mark D and Majewski Michelle A
Bought by
Majewski Mark D and Majewski Michelle A
Purchase Details
Closed on
May 2, 2002
Sold by
Reliable Homes Inc
Bought by
Reliant Homes Ltd
Purchase Details
Closed on
Aug 6, 2001
Sold by
Minnesota Life Insurance Company
Bought by
Reliable Homes Inc
Create a Home Valuation Report for This Property
The Home Valuation Report is an in-depth analysis detailing your home's value as well as a comparison with similar homes in the area
Home Values in the Area
Average Home Value in this Area
Purchase History
| Date | Buyer | Sale Price | Title Company |
|---|---|---|---|
| Rulland Jeff T | $400,000 | Watermark Title Agency | |
| Rulland Jeff T | $400,000 | Watermark Title Agency | |
| Majewski Mark D | -- | Attorney | |
| Reliant Homes Ltd | $64,900 | -- | |
| Majewski Mark D | $64,900 | -- | |
| Reliable Homes Inc | $53,000 | -- | |
| Rulland Jeff Jeff | $800,000 | -- |
Source: Public Records
Mortgage History
| Date | Status | Borrower | Loan Amount |
|---|---|---|---|
| Open | Rulland Jeff T | $709,800 | |
| Closed | Rulland Jeff T | $709,800 | |
| Closed | Rulland Jeff Jeff | $709,800 |
Source: Public Records
Tax History Compared to Growth
Tax History
| Year | Tax Paid | Tax Assessment Tax Assessment Total Assessment is a certain percentage of the fair market value that is determined by local assessors to be the total taxable value of land and additions on the property. | Land | Improvement |
|---|---|---|---|---|
| 2024 | $11,442 | $868,600 | $155,000 | $713,600 |
| 2023 | $11,442 | $855,900 | $170,000 | $685,900 |
| 2022 | $8,316 | $725,400 | $174,000 | $551,400 |
| 2021 | $7,836 | $604,500 | $145,000 | $459,500 |
| 2020 | $8,214 | $579,300 | $130,000 | $449,300 |
| 2019 | $8,462 | $593,000 | $140,000 | $453,000 |
| 2018 | $8,588 | $588,800 | $135,000 | $453,800 |
| 2017 | $8,450 | $588,800 | $160,000 | $428,800 |
| 2016 | $8,872 | $588,200 | $150,000 | $438,200 |
| 2015 | $7,984 | $595,100 | $140,000 | $455,100 |
| 2013 | -- | $483,400 | $80,600 | $402,800 |
Source: Public Records
Map
Nearby Homes
- 9031 Highview Ln
- 8918 Springwood Dr
- 3392 N View Ln
- 3208 Juniper Cir Unit A
- 3212 Juniper Cir Unit F
- 3214 Juniper Cir Unit D
- 3214 Juniper Cir Unit C
- 3936 Homestead Dr
- 9658 Wedgewood Ct
- 3600 Rae Ln
- 4418 Ashton Curve
- 8457 Savanna Oaks Ln
- 8471 Savanna Oaks Ln
- 8019 Marsh Creek Rd
- 4764 Ashton Curve
- 8525 Savanna Oaks Ln
- 2639 Oak Ridge Trail
- 9956 Antrim Rd
- 4617 Cobalt Ln
- 7608 Newbury Rd
- 8908 Highview Ln
- 3832 Kentwood Ln
- 3844 Kentwood Ln
- 8784 Springwood Dr
- 3856 Kentwood Ln
- 8916 Highview Ln
- 8901 Highview Ln
- 8909 Highview Ln
- 8832 Springwood Dr
- 8778 Springwood Dr
- 3868 Kentwood Ln
- 8924 Highview Ln
- 8792 Springwood Alcove
- 8917 Highview Ln
- 8838 Springwood Dr
- 3880 Kentwood Ln
- 8773 Springwood Dr
- 8772 Springwood Dr
- 8804 Springwood Alcove
- 3837 Kentwood Ln