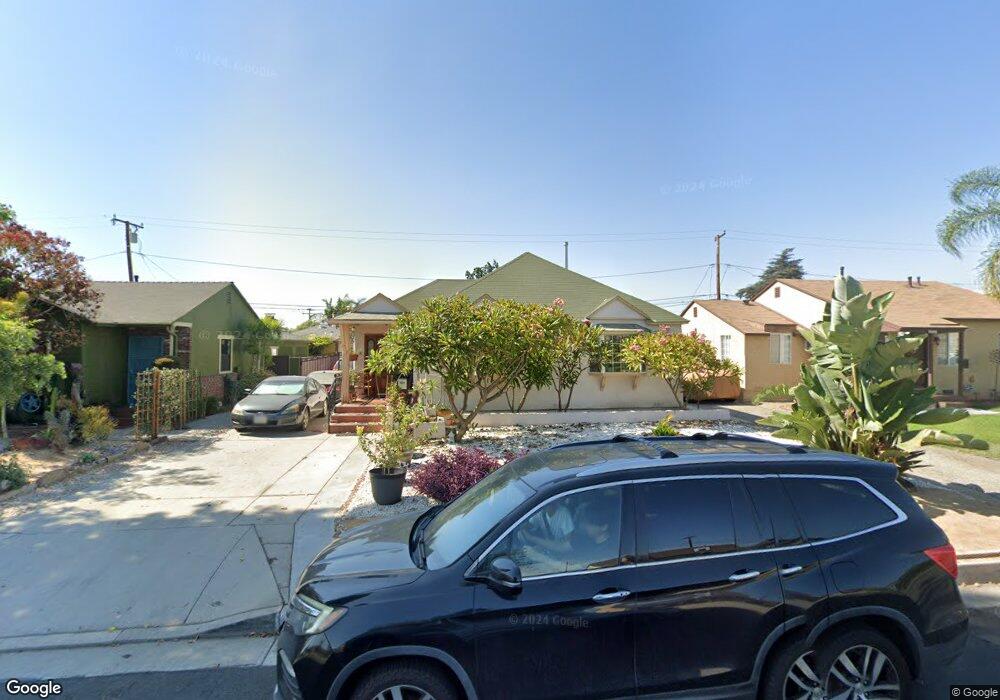
8903 Birchleaf Ave Downey, CA 90240
Estimated Value: $784,096 - $865,000
2
Beds
2
Baths
1,695
Sq Ft
$488/Sq Ft
Est. Value
About This Home
This home is located at 8903 Birchleaf Ave, Downey, CA 90240 and is currently estimated at $826,524, approximately $487 per square foot. 8903 Birchleaf Ave is a home located in Los Angeles County with nearby schools including Unsworth Elementary School, Griffiths Middle School, and Warren High School.
Ownership History
Date
Name
Owned For
Owner Type
Purchase Details
Closed on
Mar 15, 2024
Sold by
Villanueva Oscar M
Bought by
Oscar M Villanueva Family Trust and Villanueva
Current Estimated Value
Purchase Details
Closed on
Sep 7, 2005
Sold by
Villanueva Oscar M and Villanueva Perla B
Bought by
Villanueva Oscar M
Home Financials for this Owner
Home Financials are based on the most recent Mortgage that was taken out on this home.
Original Mortgage
$366,000
Interest Rate
1%
Mortgage Type
Negative Amortization
Purchase Details
Closed on
Nov 18, 1993
Sold by
Matthews Thomas Dean and Matthews Susan Alice
Bought by
Villanueva Oscar M
Home Financials for this Owner
Home Financials are based on the most recent Mortgage that was taken out on this home.
Original Mortgage
$162,000
Interest Rate
7.2%
Create a Home Valuation Report for This Property
The Home Valuation Report is an in-depth analysis detailing your home's value as well as a comparison with similar homes in the area
Purchase History
| Date | Buyer | Sale Price | Title Company |
|---|---|---|---|
| Oscar M Villanueva Family Trust | -- | None Listed On Document | |
| Oscar M Villanueva Family Trust | -- | None Listed On Document | |
| Villanueva Oscar M | -- | Lawyers Title Ins | |
| Villanueva Oscar M | $180,000 | Gateway Title Company |
Source: Public Records
Mortgage History
| Date | Status | Borrower | Loan Amount |
|---|---|---|---|
| Previous Owner | Villanueva Oscar M | $366,000 | |
| Previous Owner | Villanueva Oscar M | $162,000 |
Source: Public Records
Tax History
| Year | Tax Paid | Tax Assessment Tax Assessment Total Assessment is a certain percentage of the fair market value that is determined by local assessors to be the total taxable value of land and additions on the property. | Land | Improvement |
|---|---|---|---|---|
| 2025 | $4,128 | $305,909 | $163,153 | $142,756 |
| 2024 | $4,128 | $299,911 | $159,954 | $139,957 |
| 2023 | $3,995 | $294,031 | $156,818 | $137,213 |
| 2022 | $3,803 | $288,267 | $153,744 | $134,523 |
| 2021 | $3,708 | $282,616 | $150,730 | $131,886 |
| 2019 | $3,616 | $274,235 | $146,260 | $127,975 |
| 2018 | $3,448 | $268,859 | $143,393 | $125,466 |
| 2016 | $3,332 | $258,421 | $137,826 | $120,595 |
| 2015 | $3,285 | $254,540 | $135,756 | $118,784 |
| 2014 | $3,110 | $249,555 | $133,097 | $116,458 |
Source: Public Records
Map
Nearby Homes
- 8806 Stamps Rd
- 8906 Brock Ave
- 8326 Maxine St
- 7977 Vista Del Rosa St
- 8604 Whittle Ct
- 8901 Serapis Ave Unit 25
- 8901 Serapis Ave Unit 24
- 7354 Diamond Dr
- 9509 Downey Ave
- 8104 Arrington Ave
- 9069 Gallatin Rd
- 7745 Coolgrove Dr
- 8362 Lubec St
- 7700 Bangle Rd
- 8551 Eglise Ave
- 8611 Eglise Ave
- 8328 Buhman Ave
- 8067 Otto St
- 9530 Rives Ave
- 9273 Sierra Vista Cir
- 8827 Birchleaf Ave
- 8907 Birchleaf Ave
- 8823 Birchleaf Ave
- 8913 Birchleaf Ave
- 8902 Stamps Rd
- 8826 Stamps Rd
- 8906 Stamps Rd
- 8822 Stamps Rd
- 8912 Stamps Rd
- 8817 Birchleaf Ave
- 8917 Birchleaf Ave
- 8902 Birchleaf Ave
- 8828 Birchleaf Ave
- 8908 Birchleaf Ave
- 8816 Stamps Rd
- 8916 Stamps Rd
- 8822 Birchleaf Ave
- 8912 Birchleaf Ave
- 8813 Birchleaf Ave
- 8923 Birchleaf Ave
Your Personal Tour Guide
Ask me questions while you tour the home.