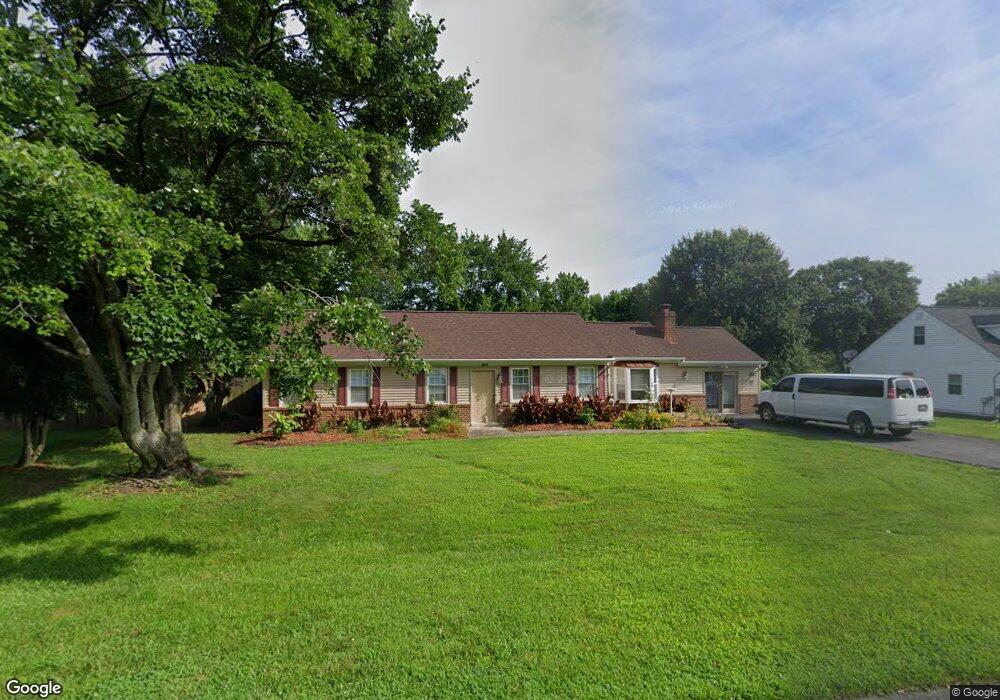
8904 Locust St Waldorf, MD 20603
Estimated Value: $409,940 - $485,000
--
Bed
2
Baths
1,848
Sq Ft
$248/Sq Ft
Est. Value
About This Home
This home is located at 8904 Locust St, Waldorf, MD 20603 and is currently estimated at $457,735, approximately $247 per square foot. 8904 Locust St is a home located in Charles County with nearby schools including William A. Diggs Elementary School, Theodore G. Davis Middle School, and North Point High School.
Ownership History
Date
Name
Owned For
Owner Type
Purchase Details
Closed on
Feb 18, 2022
Sold by
Leroy Robey Barry
Bought by
Robey Brian Dane and Whisler Allison Fay
Current Estimated Value
Home Financials for this Owner
Home Financials are based on the most recent Mortgage that was taken out on this home.
Original Mortgage
$50,000
Outstanding Balance
$46,507
Interest Rate
3.69%
Mortgage Type
Credit Line Revolving
Estimated Equity
$411,228
Purchase Details
Closed on
Mar 25, 1985
Sold by
Hein Milton F and Hein Margaret M
Bought by
Robey Barry L and Robey Brenda F
Home Financials for this Owner
Home Financials are based on the most recent Mortgage that was taken out on this home.
Original Mortgage
$79,700
Interest Rate
13.24%
Purchase Details
Closed on
Mar 2, 1984
Sold by
Cherry Walk Joint Venture Ii
Bought by
Hein Milton F and Hein Margaret M
Home Financials for this Owner
Home Financials are based on the most recent Mortgage that was taken out on this home.
Original Mortgage
$56,400
Interest Rate
13.23%
Create a Home Valuation Report for This Property
The Home Valuation Report is an in-depth analysis detailing your home's value as well as a comparison with similar homes in the area
Home Values in the Area
Average Home Value in this Area
Purchase History
| Date | Buyer | Sale Price | Title Company |
|---|---|---|---|
| Robey Brian Dane | -- | None Listed On Document | |
| Robey Barry L | $94,800 | -- | |
| Hein Milton F | $63,300 | -- |
Source: Public Records
Mortgage History
| Date | Status | Borrower | Loan Amount |
|---|---|---|---|
| Open | Robey Brian Dane | $50,000 | |
| Previous Owner | Robey Barry L | $79,700 | |
| Previous Owner | Hein Milton F | $56,400 |
Source: Public Records
Tax History Compared to Growth
Tax History
| Year | Tax Paid | Tax Assessment Tax Assessment Total Assessment is a certain percentage of the fair market value that is determined by local assessors to be the total taxable value of land and additions on the property. | Land | Improvement |
|---|---|---|---|---|
| 2025 | $10,276 | $353,800 | $120,200 | $233,600 |
| 2024 | $4,450 | $323,033 | $0 | $0 |
| 2023 | $4,177 | $292,267 | $0 | $0 |
| 2022 | $3,712 | $261,500 | $110,100 | $151,400 |
| 2021 | $7,656 | $253,467 | $0 | $0 |
| 2020 | $3,456 | $245,433 | $0 | $0 |
| 2019 | $7,041 | $237,400 | $110,100 | $127,300 |
| 2018 | $3,086 | $234,333 | $0 | $0 |
| 2017 | $3,145 | $231,267 | $0 | $0 |
| 2016 | -- | $228,200 | $0 | $0 |
| 2015 | $2,869 | $228,200 | $0 | $0 |
| 2014 | $2,869 | $228,200 | $0 | $0 |
Source: Public Records
Map
Nearby Homes
- 2577 Laurel Branch Dr
- 8809 Silverleaf St
- 2411 Pimpernel Dr
- 2675 Laurel Branch Dr
- 8818 Cottongrass St
- 2717 Vista Ct
- 2816 Ridge Rd
- 2335 Audrey Manor Ct
- 8770 Bensville Rd
- 8543 Anderegg Place
- 2404 Berry Thicket Ct
- 2631 Academic Ct
- 2652 Academic Ct
- 3028 Bramblewood Ct
- 7945 Bensville Rd
- 9599 Pep Rally Ln
- 9414 Pep Rally Ln
- 1114 Bohac Ln
- 17100 Sweetgum Ct
- 1116 Bohac Ln
- 2570 Laurel Branch Dr
- 2566 Laurel Branch Dr
- 2562 Laurel Branch Dr
- 8912 Locust St
- 8916 Locust St
- 8905 Locust St
- 8909 Locust St
- 2580 Laurel Branch Dr
- 8913 Locust St
- 2558 Laurel Branch Dr
- 8920 Locust St
- 8761 Valley Dr
- 2569 Laurel Branch Dr
- 8924 Locust St
- 8917 Locust St
- 2573 Laurel Branch Dr
- 8805 Silverleaf St
- 8801 Silverleaf St
- 8921 Locust St
- 8925 Locust St