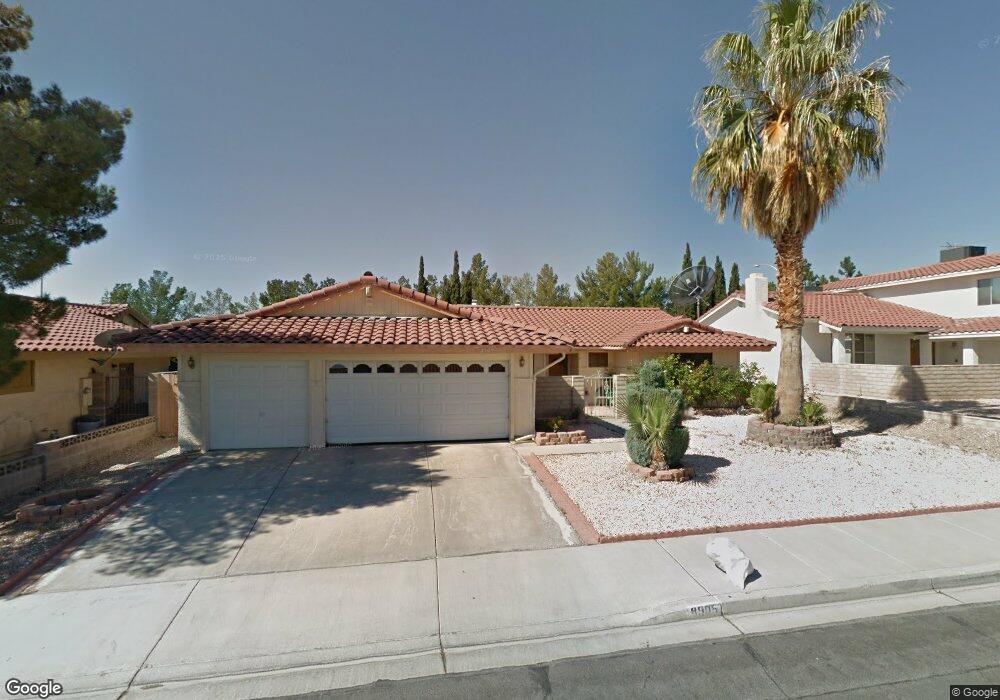
8905 Dio Guardi Dr Las Vegas, NV 89117
Canyon Gate NeighborhoodEstimated Value: $458,000 - $564,000
3
Beds
2
Baths
1,640
Sq Ft
$315/Sq Ft
Est. Value
About This Home
This home is located at 8905 Dio Guardi Dr, Las Vegas, NV 89117 and is currently estimated at $516,959, approximately $315 per square foot. 8905 Dio Guardi Dr is a home located in Clark County with nearby schools including Clarence A. Piggott Academy of International Studies, D'Vorre & Hal Ober Elementary School, and Walter Johnson Junior High School Academy of International Studies.
Ownership History
Date
Name
Owned For
Owner Type
Purchase Details
Closed on
Aug 22, 1997
Sold by
Gagliani Deborah K
Bought by
Gagliani Joseph A
Current Estimated Value
Home Financials for this Owner
Home Financials are based on the most recent Mortgage that was taken out on this home.
Original Mortgage
$114,000
Outstanding Balance
$16,264
Interest Rate
7.45%
Estimated Equity
$500,695
Purchase Details
Closed on
Jul 22, 1997
Sold by
Gagliani Lena M and Gagliani Joseph A
Bought by
Ruiz Jose B and Ruiz Evangelina L
Home Financials for this Owner
Home Financials are based on the most recent Mortgage that was taken out on this home.
Original Mortgage
$114,000
Outstanding Balance
$16,264
Interest Rate
7.45%
Estimated Equity
$500,695
Purchase Details
Closed on
Apr 1, 1995
Sold by
Gagliani Lena M
Bought by
Gagliani Lena M and Gagliani Joseph A
Create a Home Valuation Report for This Property
The Home Valuation Report is an in-depth analysis detailing your home's value as well as a comparison with similar homes in the area
Home Values in the Area
Average Home Value in this Area
Purchase History
| Date | Buyer | Sale Price | Title Company |
|---|---|---|---|
| Gagliani Joseph A | -- | Old Republic Title Company | |
| Ruiz Jose B | $142,500 | Old Republic Title Company | |
| Gagliani Lena M | -- | -- |
Source: Public Records
Mortgage History
| Date | Status | Borrower | Loan Amount |
|---|---|---|---|
| Open | Ruiz Jose B | $114,000 |
Source: Public Records
Tax History Compared to Growth
Tax History
| Year | Tax Paid | Tax Assessment Tax Assessment Total Assessment is a certain percentage of the fair market value that is determined by local assessors to be the total taxable value of land and additions on the property. | Land | Improvement |
|---|---|---|---|---|
| 2025 | $2,476 | $96,027 | $45,850 | $50,177 |
| 2024 | $2,405 | $96,027 | $45,850 | $50,177 |
| 2023 | $2,405 | $91,731 | $43,050 | $48,681 |
| 2022 | $2,448 | $80,667 | $35,700 | $44,967 |
| 2021 | $2,267 | $75,045 | $31,850 | $43,195 |
| 2020 | $2,102 | $71,926 | $28,700 | $43,226 |
| 2019 | $1,970 | $70,137 | $27,300 | $42,837 |
| 2018 | $1,880 | $66,707 | $24,850 | $41,857 |
| 2017 | $2,197 | $67,018 | $24,150 | $42,868 |
| 2016 | $1,760 | $62,579 | $19,250 | $43,329 |
| 2015 | $1,756 | $54,231 | $15,050 | $39,181 |
| 2014 | $1,701 | $50,353 | $11,200 | $39,153 |
Source: Public Records
Map
Nearby Homes
- 8908 Dio Guardi Dr
- 1601 Sun Ridge Dr
- 1605 Shadow Rock Dr
- 8928 Echo Ridge Dr
- 1616 Shadow Rock Dr
- 1613 Shadow Rock Dr
- 1609 Hidden Spring Dr
- 8969 Rivers Edge Dr
- 8908 Silvagni Dr
- 9029 Rivers Edge Dr
- 1432 Castle Crest Dr
- 8808 Silvagni Dr
- 8756 Potenza Ln
- 8901 Robinson Ridge Dr
- 8821 Robinson Ridge Dr
- 8949 Diamond Falls Dr
- 9008 Emerald Hill Way
- 8721 Robinson Ridge Dr
- 8813 Pavia Dr
- 9204 Vosburgh Dr
- 8909 Dio Guardi Dr
- 8901 Dio Guardi Dr
- 8913 Dio Guardi Dr
- 8904 Dio Guardi Dr
- 8972 Echo Ridge Dr
- 8976 Echo Ridge Dr
- 8900 Dio Guardi Dr
- 8968 Echo Ridge Dr
- 8980 Echo Ridge Dr
- 8964 Echo Ridge Dr
- 8984 Echo Ridge Dr
- 8917 Dio Guardi Dr
- 1629 Odette Ln
- 1625 Odette Ln
- 8916 Dio Guardi Dr
- 8905 Condotti Ct
- 8960 Echo Ridge Dr
- 8960 Echo Ridge Dr
- 8960 Echo Ridge Dr Unit n/a
- 9000 Echo Ridge Dr Unit 4