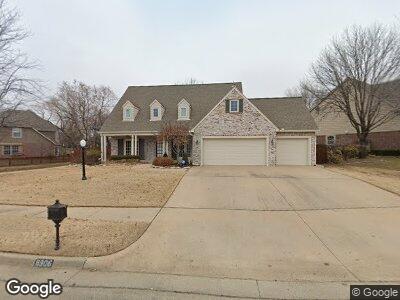
8906 N 104th East Ave Owasso, OK 74055
Estimated Value: $377,448 - $415,000
--
Bed
3
Baths
2,635
Sq Ft
$152/Sq Ft
Est. Value
About This Home
This home is located at 8906 N 104th East Ave, Owasso, OK 74055 and is currently estimated at $399,612, approximately $151 per square foot. 8906 N 104th East Ave is a home located in Tulsa County with nearby schools including Larkin Bailey Elementary School, Owasso 6th Grade Center, and Owasso 7th Grade Center.
Ownership History
Date
Name
Owned For
Owner Type
Purchase Details
Closed on
Mar 26, 2007
Sold by
Banks Randy W
Bought by
Harmon Robert E and Harmon Angela R
Current Estimated Value
Home Financials for this Owner
Home Financials are based on the most recent Mortgage that was taken out on this home.
Original Mortgage
$180,000
Interest Rate
6.3%
Mortgage Type
Purchase Money Mortgage
Purchase Details
Closed on
Apr 30, 2003
Sold by
Clayton Susan Gail and Banks Susan Gail
Bought by
Banks Randy W
Purchase Details
Closed on
Jul 29, 1997
Sold by
Simmons Homes Inc
Bought by
Banks Randy W
Home Financials for this Owner
Home Financials are based on the most recent Mortgage that was taken out on this home.
Original Mortgage
$121,000
Interest Rate
7.6%
Mortgage Type
Purchase Money Mortgage
Purchase Details
Closed on
Jan 1, 1997
Bought by
Not Available From County
Create a Home Valuation Report for This Property
The Home Valuation Report is an in-depth analysis detailing your home's value as well as a comparison with similar homes in the area
Home Values in the Area
Average Home Value in this Area
Purchase History
| Date | Buyer | Sale Price | Title Company |
|---|---|---|---|
| Harmon Robert E | $230,000 | Firstitle & Abstract Service | |
| Banks Randy W | -- | -- | |
| Banks Randy W | $170,500 | Tulsa Abstract & Title Co | |
| -- | $27,000 | -- |
Source: Public Records
Mortgage History
| Date | Status | Borrower | Loan Amount |
|---|---|---|---|
| Open | Harmon Robert E | $95,500 | |
| Closed | Harmon Robert E | $178,000 | |
| Closed | Harmon Robert E | $180,000 | |
| Previous Owner | Banks Randy W | $121,000 |
Source: Public Records
Tax History Compared to Growth
Tax History
| Year | Tax Paid | Tax Assessment Tax Assessment Total Assessment is a certain percentage of the fair market value that is determined by local assessors to be the total taxable value of land and additions on the property. | Land | Improvement |
|---|---|---|---|---|
| 2024 | $2,866 | $27,154 | $3,381 | $23,773 |
| 2023 | $2,866 | $27,333 | $3,678 | $23,655 |
| 2022 | $2,902 | $25,537 | $3,672 | $21,865 |
| 2021 | $2,786 | $24,764 | $4,441 | $20,323 |
| 2020 | $2,786 | $24,764 | $4,441 | $20,323 |
| 2019 | $2,774 | $24,764 | $4,441 | $20,323 |
| 2018 | $2,687 | $24,764 | $4,441 | $20,323 |
| 2017 | $2,696 | $25,764 | $4,620 | $21,144 |
| 2016 | $2,706 | $25,764 | $4,620 | $21,144 |
| 2015 | $2,726 | $25,764 | $4,620 | $21,144 |
| 2014 | $2,751 | $25,764 | $4,620 | $21,144 |
Source: Public Records
Map
Nearby Homes
- 8907 N 104th Ave E
- 212 W 17th St
- 10102 E 91st Cir N
- 10201 E 92nd St N
- 9201 N 101st Ave E
- 9707 E 90th Ct N
- 10014 E 93rd St N
- 10115 E 94th St N
- 1605 N Dogwood St
- 306 E 23rd St
- 8402 N 100th Ave E
- 9303 N 105th Ave E
- 9302 N 98th Ct E
- 10301 E 94th Ct N
- 9302 E 91st St N
- 9203 E 94th St N
- 9401 N 95th Place E
- 10001 E 95th St N
- 504 E 8th St
- 6612 N Granite Ln
- 8906 N 104th East Ave
- 8908 E 104th Place N
- 8908 N 104th East Ave
- 10307 E 89th St N
- 8904 N 104th Ave E
- 8905 N 103rd East Ave
- 10302 E 90th St N
- 8903 N 103rd East Ave
- 10304 E 90th St N
- 8901 N 103rd East Ave
- 10306 E 90th St N
- 11727 N 103rd Ave E
- 8901 N 103rd Ave E
- 8903 N 104th East Ave
- 8907 N 104th East Ave
- 10308 E 89th St N
- 8909 N 104th East Ave
- 8905 N 104th East Ave
- 8905 E 104th Place N
- 10306 E 89th St N