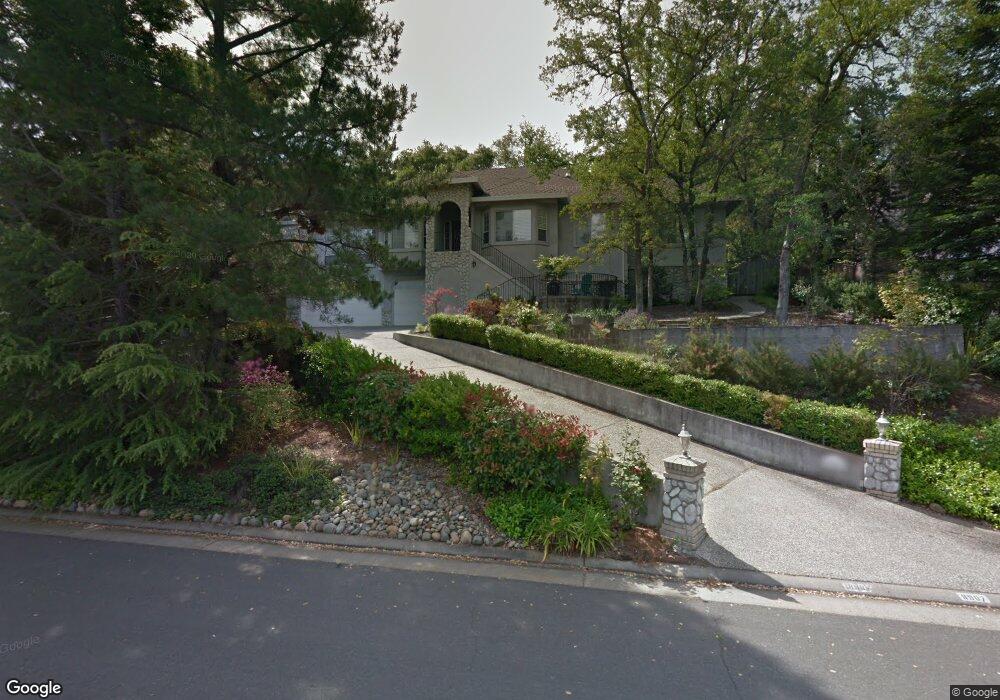
8907 Bronson Dr Granite Bay, CA 95746
Estimated Value: $905,000 - $1,081,665
4
Beds
3
Baths
2,710
Sq Ft
$369/Sq Ft
Est. Value
About This Home
This home is located at 8907 Bronson Dr, Granite Bay, CA 95746 and is currently estimated at $998,666, approximately $368 per square foot. 8907 Bronson Dr is a home located in Placer County with nearby schools including Greenhills Elementary School, Ridgeview Elementary School, and Willma Cavitt Junior High School.
Ownership History
Date
Name
Owned For
Owner Type
Purchase Details
Closed on
Oct 26, 2020
Sold by
Yoder Terry L and Yoder Ellen L
Bought by
Yoder Terry L and Yoder Ellen L
Current Estimated Value
Home Financials for this Owner
Home Financials are based on the most recent Mortgage that was taken out on this home.
Original Mortgage
$304,000
Outstanding Balance
$270,517
Interest Rate
2.8%
Mortgage Type
New Conventional
Estimated Equity
$728,149
Purchase Details
Closed on
Mar 27, 2014
Sold by
Yoder Terry L and Yoder Ellen L
Bought by
Revoc Terrence and Revoc Ellen
Purchase Details
Closed on
Nov 17, 1994
Sold by
Phelps Curry Donald L and Phelps Curry Katherine
Bought by
Yoder Terry L and Yoder Ellen L
Home Financials for this Owner
Home Financials are based on the most recent Mortgage that was taken out on this home.
Original Mortgage
$265,205
Interest Rate
5.95%
Mortgage Type
Purchase Money Mortgage
Create a Home Valuation Report for This Property
The Home Valuation Report is an in-depth analysis detailing your home's value as well as a comparison with similar homes in the area
Home Values in the Area
Average Home Value in this Area
Purchase History
| Date | Buyer | Sale Price | Title Company |
|---|---|---|---|
| Yoder Terry L | -- | Stewart Title Of Placer | |
| Revoc Terrence | -- | None Available | |
| Yoder Terry L | $295,000 | Sierra Valley Title |
Source: Public Records
Mortgage History
| Date | Status | Borrower | Loan Amount |
|---|---|---|---|
| Open | Yoder Terry L | $304,000 | |
| Closed | Yoder Terry L | $265,205 |
Source: Public Records
Tax History
| Year | Tax Paid | Tax Assessment Tax Assessment Total Assessment is a certain percentage of the fair market value that is determined by local assessors to be the total taxable value of land and additions on the property. | Land | Improvement |
|---|---|---|---|---|
| 2025 | $6,576 | $570,788 | $167,954 | $402,834 |
| 2023 | $6,576 | $548,626 | $161,433 | $387,193 |
| 2022 | $6,475 | $537,869 | $158,268 | $379,601 |
| 2021 | $6,361 | $527,323 | $155,165 | $372,158 |
| 2020 | $6,347 | $521,916 | $153,574 | $368,342 |
| 2019 | $6,309 | $511,683 | $150,563 | $361,120 |
| 2018 | $6,080 | $501,651 | $147,611 | $354,040 |
| 2017 | $6,113 | $491,816 | $144,717 | $347,099 |
| 2016 | $5,985 | $482,174 | $141,880 | $340,294 |
| 2015 | $5,875 | $474,932 | $139,749 | $335,183 |
| 2014 | $5,794 | $465,630 | $137,012 | $328,618 |
Source: Public Records
Map
Nearby Homes
- 7582 Lakeshore Dr
- 8880 Auburn Folsom Rd Unit 20
- 8880 Auburn Folsom Rd Unit 29
- 8880 Auburn Folsom Rd Unit 25
- 8880 Auburn Folsom Rd
- 7110 Soleil Way
- 7080 Soleil Way
- 8464 Sun View Cir
- 8460 Sun View Cir
- 7090 Soleil Way
- 9041 Ventura St
- 9060 Auburn Folsom Rd Unit 36
- 9060 Auburn Folsom Rd Unit 7
- 9060 Auburn Folsom Rd Unit 9
- 9060 Auburn Folsom Rd Unit 32
- 9046 Ventura St
- 6766 Micherra Cir
- 6752 Micherra Cir
- 8420 Lakeland Dr
- 9274 Auburn Folsom Rd
- 8927 Bronson Dr
- 8897 Bronson Dr
- 7235 Sierra Dr
- 8937 Bronson Dr
- 7205 Sierra Dr
- 8912 Bronson Dr
- 8887 Bronson Dr
- 7265 Sierra Dr
- 8902 Bronson Dr
- 8892 Bronson Dr
- 8957 Bronson Dr
- 8942 Bronson Dr
- 7185 Sierra Dr
- 8877 Bronson Dr
- 7240 Hill Rd
- 7305 Sierra Dr
- 7335 Sierra Dr
- 8872 Bronson Dr
- 8914 Weatherby Ct
- 7235 Hill Rd
Your Personal Tour Guide
Ask me questions while you tour the home.