Estimated Value: $476,000 - $529,679
3
Beds
2
Baths
1,860
Sq Ft
$272/Sq Ft
Est. Value
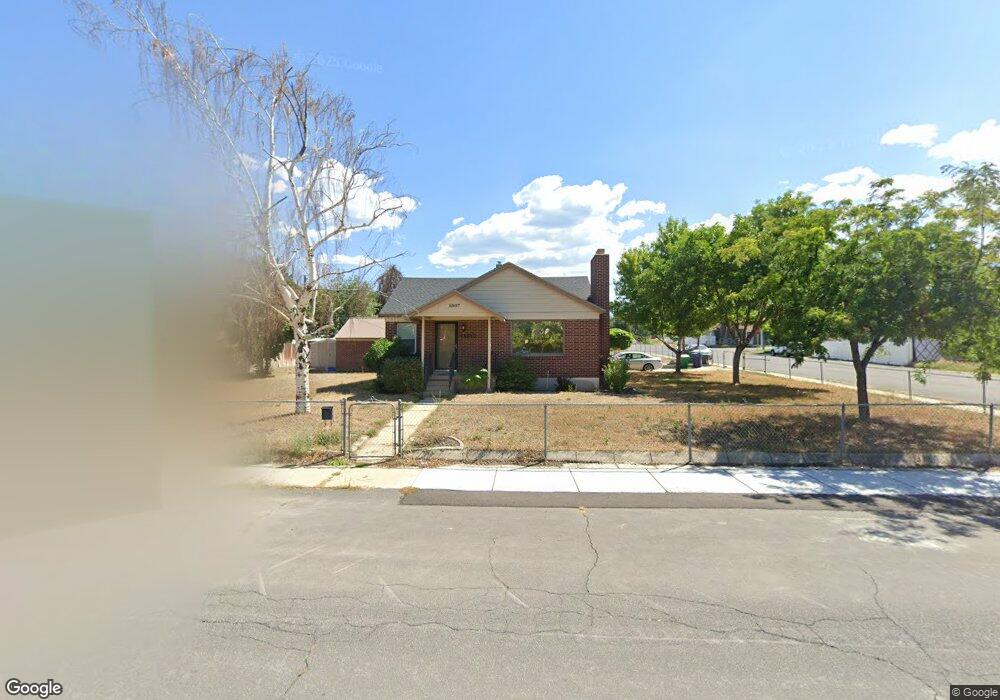
About This Home
This home is located at 8907 S 250 E, Sandy, UT 84070 and is currently estimated at $505,420, approximately $271 per square foot. 8907 S 250 E is a home located in Salt Lake County with nearby schools including Sandy Elementary School, Mount Jordan Middle School, and Jordan High.
Ownership History
Date
Name
Owned For
Owner Type
Purchase Details
Closed on
Oct 31, 2025
Sold by
Kenney Jennifer
Bought by
Kenney Jennifer and Bockenstedt Connie
Current Estimated Value
Purchase Details
Closed on
Dec 5, 2020
Sold by
Herrera Leigh and Herrera Rodolfo
Bought by
Kenney Jennifer
Home Financials for this Owner
Home Financials are based on the most recent Mortgage that was taken out on this home.
Original Mortgage
$335,750
Interest Rate
2.8%
Mortgage Type
New Conventional
Purchase Details
Closed on
Jul 6, 2016
Sold by
Robins Leigh A
Bought by
Herrera Leigh and Herrera Rodolfo
Purchase Details
Closed on
Apr 8, 2014
Sold by
Webster Barry G and Webster Jessica E
Bought by
Robins Leigh A
Home Financials for this Owner
Home Financials are based on the most recent Mortgage that was taken out on this home.
Original Mortgage
$189,000
Interest Rate
4.32%
Mortgage Type
New Conventional
Purchase Details
Closed on
Oct 20, 2006
Sold by
Lunt Nathan V and Lunt Kelli A
Bought by
Webster Barry G and Webster Jessica E
Home Financials for this Owner
Home Financials are based on the most recent Mortgage that was taken out on this home.
Original Mortgage
$168,000
Interest Rate
6.39%
Mortgage Type
Purchase Money Mortgage
Purchase Details
Closed on
Oct 25, 2005
Sold by
Lunt Nathan V and Lunt Keli A
Bought by
Lunt Nathan and Lunt Kelli A
Home Financials for this Owner
Home Financials are based on the most recent Mortgage that was taken out on this home.
Original Mortgage
$124,000
Interest Rate
5.68%
Mortgage Type
New Conventional
Purchase Details
Closed on
May 17, 2004
Sold by
Lunt Nathan V
Bought by
Lunt Nathan and Lunt Keli A
Home Financials for this Owner
Home Financials are based on the most recent Mortgage that was taken out on this home.
Original Mortgage
$124,200
Interest Rate
5.12%
Mortgage Type
New Conventional
Purchase Details
Closed on
Oct 6, 2003
Sold by
Lunt Nathan V
Bought by
Lunt Nathan and Lunt Keli A
Home Financials for this Owner
Home Financials are based on the most recent Mortgage that was taken out on this home.
Original Mortgage
$123,300
Interest Rate
6.22%
Mortgage Type
Purchase Money Mortgage
Purchase Details
Closed on
Nov 8, 1995
Sold by
Robison Linda J and Wallin Linda J
Bought by
Robison Linda J
Purchase Details
Closed on
Aug 15, 1995
Sold by
Wallin Robert V and Wallin Linda J
Bought by
Wallin Linda J
Home Financials for this Owner
Home Financials are based on the most recent Mortgage that was taken out on this home.
Original Mortgage
$54,500
Interest Rate
7.71%
Create a Home Valuation Report for This Property
The Home Valuation Report is an in-depth analysis detailing your home's value as well as a comparison with similar homes in the area
Home Values in the Area
Average Home Value in this Area
Purchase History
| Date | Buyer | Sale Price | Title Company |
|---|---|---|---|
| Kenney Jennifer | -- | Accommodation/Courtesy Recordi | |
| Kenney Jennifer | -- | Highland Title Agency | |
| Herrera Leigh | -- | Keystone Title Ins Agency Ll | |
| Robins Leigh A | -- | Bonneville Superior Title | |
| Webster Barry G | -- | Bonneville Superior Title | |
| Lunt Nathan | -- | First American Title | |
| Lunt Nathan | -- | Metro National Title | |
| Lunt Nathan | -- | Metro National Title | |
| Lunt Nathan | -- | Surety Title | |
| Lunt Nathan | -- | Surety Title | |
| Robison Linda J | -- | -- | |
| Wallin Linda J | -- | -- |
Source: Public Records
Mortgage History
| Date | Status | Borrower | Loan Amount |
|---|---|---|---|
| Previous Owner | Kenney Jennifer | $335,750 | |
| Previous Owner | Robins Leigh A | $189,000 | |
| Previous Owner | Webster Barry G | $168,000 | |
| Previous Owner | Lunt Nathan | $124,000 | |
| Previous Owner | Lunt Nathan | $124,200 | |
| Previous Owner | Lunt Nathan | $123,300 | |
| Previous Owner | Wallin Linda J | $54,500 |
Source: Public Records
Tax History
| Year | Tax Paid | Tax Assessment Tax Assessment Total Assessment is a certain percentage of the fair market value that is determined by local assessors to be the total taxable value of land and additions on the property. | Land | Improvement |
|---|---|---|---|---|
| 2025 | $2,608 | $526,500 | $134,500 | $392,000 |
| 2024 | $2,608 | $482,300 | $123,400 | $358,900 |
| 2023 | $2,342 | $431,900 | $117,300 | $314,600 |
| 2022 | $2,484 | $447,500 | $115,000 | $332,500 |
| 2021 | $1,940 | $297,500 | $90,000 | $207,500 |
| 2020 | $1,829 | $264,500 | $90,000 | $174,500 |
| 2019 | $1,721 | $242,500 | $90,000 | $152,500 |
| 2018 | $1,487 | $218,200 | $70,000 | $148,200 |
| 2017 | $1,450 | $203,300 | $64,800 | $138,500 |
| 2016 | $1,422 | $192,600 | $64,800 | $127,800 |
| 2015 | $1,468 | $184,000 | $66,100 | $117,900 |
| 2014 | $1,435 | $176,300 | $64,200 | $112,100 |
Source: Public Records
Map
Nearby Homes
- 270 E 8680 S
- 8558 S Center St
- 112 E 8680 S
- 181 E 9180 S
- 362 E 9150 S
- 220 E Pioneer Ave
- 194 Pioneer Ave
- 149 E Pioneer Ave
- 8732 S 620 E
- 87 Pioneer Ave
- 8459 S 300 E
- 8470 Solar Way
- 87 W 8710 S
- 48 E Apollo Way
- 487 E 9270 S
- 359 E 8400 S
- 136 W Freedom Ave Unit 136
- 37 Crawford Place
- 140 W 8710 S
- 566 E 9270 S
- 8908 S 280 E
- 8889 S 250 E
- 8898 S 280 E
- 8910 S 250 E
- 8933 S 250 E
- 8888 S 280 E
- 8890 S 250 E
- 8930 S 280 E
- 244 E 8920 S
- 234 E 8880 S
- 8943 S 250 E
- 8897 S 280 E
- 8938 S 250 E
- 265 E 8880 S Unit 8
- 265 E 8880 S Unit 1
- 265 E 8880 S Unit 11
- 265 E 8880 S Unit 4
- 265 E 8880 S Unit 16
- 265 E 8880 S Unit 5
- 265 E 8880 S Unit 17
Your Personal Tour Guide
Ask me questions while you tour the home.