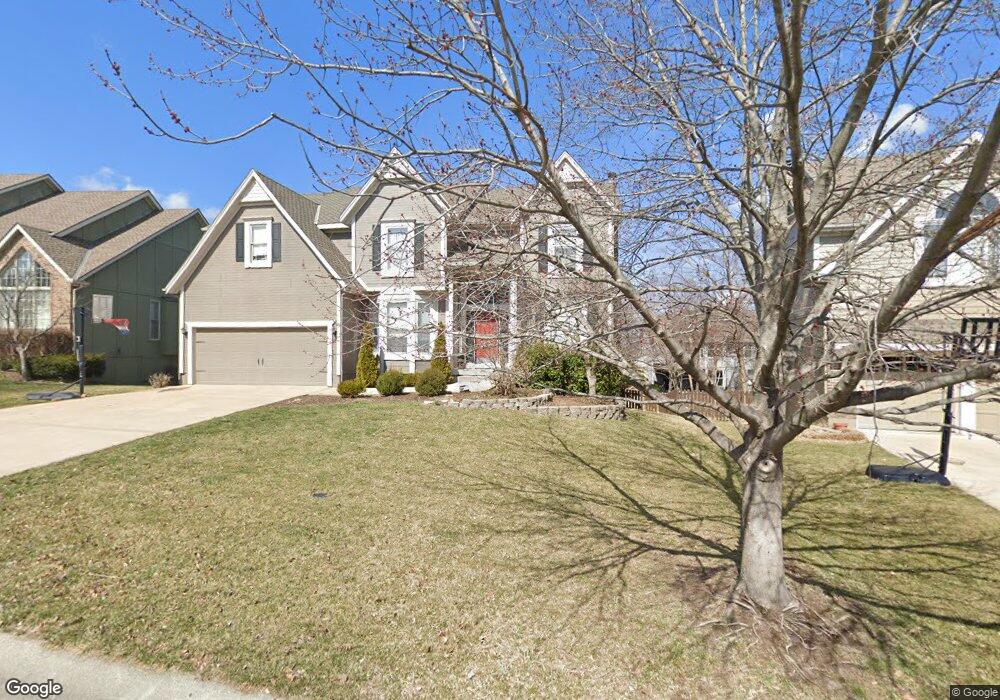
8908 W 148th Terrace Overland Park, KS 66221
South Overland Park NeighborhoodEstimated Value: $566,000 - $690,000
5
Beds
5
Baths
2,693
Sq Ft
$229/Sq Ft
Est. Value
About This Home
This home is located at 8908 W 148th Terrace, Overland Park, KS 66221 and is currently estimated at $616,550, approximately $228 per square foot. 8908 W 148th Terrace is a home located in Johnson County with nearby schools including Sunset Ridge Elementary School, Lakewood Middle School, and Blue Valley West High School.
Ownership History
Date
Name
Owned For
Owner Type
Purchase Details
Closed on
Sep 8, 2008
Sold by
Hefferon Daniel J and Hefferon Jan L
Bought by
Cate Michael A
Current Estimated Value
Home Financials for this Owner
Home Financials are based on the most recent Mortgage that was taken out on this home.
Original Mortgage
$277,650
Outstanding Balance
$185,117
Interest Rate
6.57%
Mortgage Type
New Conventional
Estimated Equity
$431,433
Purchase Details
Closed on
Feb 16, 2001
Sold by
Bourdon John C and Bourdon Alice G
Bought by
Ramsey Christopher D and Ramsey Andrea P
Home Financials for this Owner
Home Financials are based on the most recent Mortgage that was taken out on this home.
Original Mortgage
$266,950
Interest Rate
6.97%
Create a Home Valuation Report for This Property
The Home Valuation Report is an in-depth analysis detailing your home's value as well as a comparison with similar homes in the area
Home Values in the Area
Average Home Value in this Area
Purchase History
| Date | Buyer | Sale Price | Title Company |
|---|---|---|---|
| Cate Michael A | -- | Kansas City Title | |
| Ramsey Christopher D | -- | Chicago Title Insurance Co |
Source: Public Records
Mortgage History
| Date | Status | Borrower | Loan Amount |
|---|---|---|---|
| Open | Cate Michael A | $277,650 | |
| Previous Owner | Ramsey Christopher D | $266,950 |
Source: Public Records
Tax History Compared to Growth
Tax History
| Year | Tax Paid | Tax Assessment Tax Assessment Total Assessment is a certain percentage of the fair market value that is determined by local assessors to be the total taxable value of land and additions on the property. | Land | Improvement |
|---|---|---|---|---|
| 2024 | $5,814 | $56,764 | $10,935 | $45,829 |
| 2023 | $5,923 | $56,833 | $10,935 | $45,898 |
| 2022 | $5,420 | $51,106 | $10,935 | $40,171 |
| 2021 | $5,018 | $44,919 | $9,115 | $35,804 |
| 2020 | $5,049 | $44,885 | $7,004 | $37,881 |
| 2019 | $5,114 | $44,505 | $6,388 | $38,117 |
| 2018 | $4,905 | $41,837 | $6,388 | $35,449 |
| 2017 | $4,707 | $39,445 | $6,388 | $33,057 |
| 2016 | $4,350 | $36,432 | $6,388 | $30,044 |
| 2015 | $4,303 | $35,891 | $6,388 | $29,503 |
| 2013 | -- | $33,902 | $6,388 | $27,514 |
Source: Public Records
Map
Nearby Homes
- 14909 Benson St
- 9016 W 148th Terrace
- 9013 W 148th St
- 8403 W 150th St
- 9206 W 146th Place
- 8300 W 148th St
- 14808 Carter St
- 8216 W 146th Terrace
- 14409 Grandview St
- 9519 W 151st Terrace
- 14605 Carter St
- 14602 Grant Ln
- 8317 W 144th Place
- 8503 W 153rd St
- 9309 W 144th Terrace
- 8111 W 145th Terrace
- 9911 W 145th Ct
- 9801 W 152nd St
- 14312 Mackey St
- 15450 Antioch Rd
- 8912 W 148th Terrace
- 8904 W 148th Terrace
- 8909 W 148th St
- 8916 W 148th Terrace
- 8913 W 148th St
- 8900 W 148th Terrace
- 8905 W 148th Terrace
- 8901 W 148th Terrace
- 8900 W 148 Terrace
- 14808 Benson St
- 8917 W 148th St
- 8909 W 148th Terrace
- 9000 W 148th Terrace
- 14804 Benson St
- 9001 W 148th Terrace
- 14805 Eby St
- 9004 W 148th Terrace
- 8902 W 149th St
- 8816 W 148th Terrace