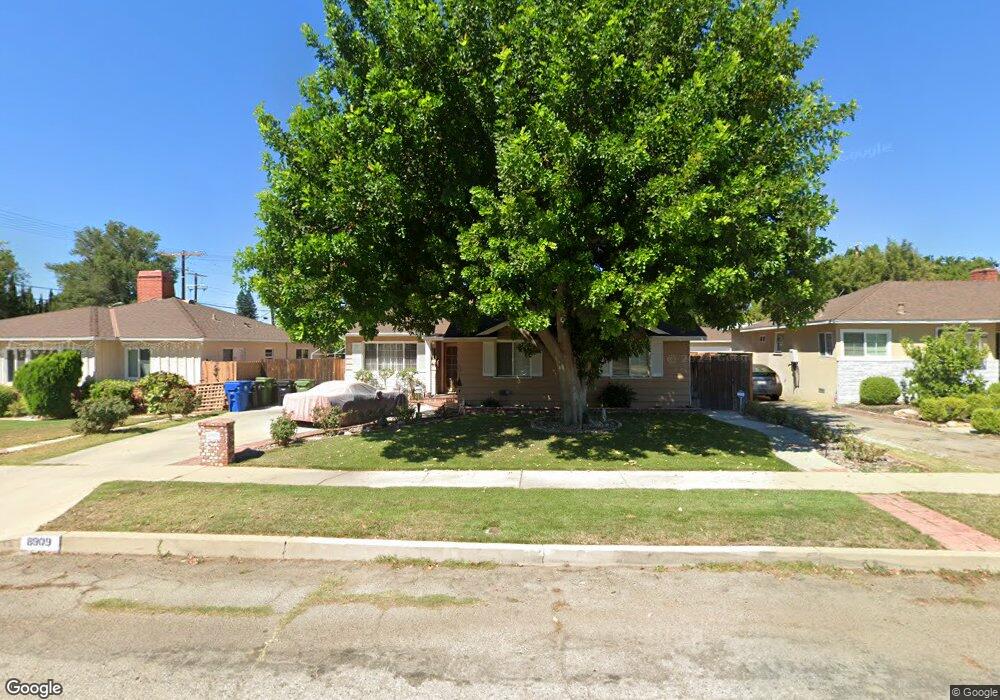
8909 Nestle Ave Northridge, CA 91325
Estimated Value: $781,877 - $964,000
3
Beds
2
Baths
1,527
Sq Ft
$573/Sq Ft
Est. Value
About This Home
This home is located at 8909 Nestle Ave, Northridge, CA 91325 and is currently estimated at $875,219, approximately $573 per square foot. 8909 Nestle Ave is a home located in Los Angeles County with nearby schools including Northridge Middle School, Northridge Academy High, and Valley Academy of Arts & Sciences.
Ownership History
Date
Name
Owned For
Owner Type
Purchase Details
Closed on
Oct 9, 2020
Sold by
Ulm Eric
Bought by
Ulm Eric
Current Estimated Value
Home Financials for this Owner
Home Financials are based on the most recent Mortgage that was taken out on this home.
Original Mortgage
$340,000
Outstanding Balance
$302,412
Interest Rate
2.9%
Mortgage Type
New Conventional
Estimated Equity
$572,807
Purchase Details
Closed on
Nov 5, 1998
Sold by
Ulm Polly J
Bought by
Ulm Eric
Home Financials for this Owner
Home Financials are based on the most recent Mortgage that was taken out on this home.
Original Mortgage
$148,500
Interest Rate
6.54%
Purchase Details
Closed on
Oct 3, 1995
Sold by
Goldwater Stephen M and Goldwater Candace
Bought by
Ulm Eric
Home Financials for this Owner
Home Financials are based on the most recent Mortgage that was taken out on this home.
Original Mortgage
$150,350
Interest Rate
7.58%
Create a Home Valuation Report for This Property
The Home Valuation Report is an in-depth analysis detailing your home's value as well as a comparison with similar homes in the area
Home Values in the Area
Average Home Value in this Area
Purchase History
| Date | Buyer | Sale Price | Title Company |
|---|---|---|---|
| Ulm Eric | -- | Bnt Title Company Of Ca | |
| Ulm Eric | -- | Landsafe Title | |
| Ulm Eric | $155,000 | Gateway Title Company |
Source: Public Records
Mortgage History
| Date | Status | Borrower | Loan Amount |
|---|---|---|---|
| Open | Ulm Eric | $340,000 | |
| Closed | Ulm Eric | $148,500 | |
| Closed | Ulm Eric | $150,350 |
Source: Public Records
Tax History
| Year | Tax Paid | Tax Assessment Tax Assessment Total Assessment is a certain percentage of the fair market value that is determined by local assessors to be the total taxable value of land and additions on the property. | Land | Improvement |
|---|---|---|---|---|
| 2025 | $3,254 | $257,467 | $139,532 | $117,935 |
| 2024 | $3,254 | $252,420 | $136,797 | $115,623 |
| 2023 | $3,194 | $247,471 | $134,115 | $113,356 |
| 2022 | $3,050 | $242,620 | $131,486 | $111,134 |
| 2021 | $3,005 | $237,863 | $128,908 | $108,955 |
| 2019 | $2,917 | $230,810 | $125,086 | $105,724 |
| 2018 | $2,800 | $226,285 | $122,634 | $103,651 |
| 2016 | $2,660 | $217,500 | $117,873 | $99,627 |
| 2015 | $2,621 | $214,234 | $116,103 | $98,131 |
| 2014 | $2,637 | $210,038 | $113,829 | $96,209 |
Source: Public Records
Map
Nearby Homes
- 8800 Etiwanda Ave Unit 7
- 18318 Gresham St
- 8730 Etiwanda Ave
- 8807 Canby Ave
- 9027 Lindley Ave
- 17933 Osborne St
- 18350 Napa St
- 8540 Chimineas Ave
- 18535 Bryant St
- 18251 Chase St
- 9301 Darby Ave
- 18557 Napa St
- 17716 Nordhoff St
- 8421 Lindley Ave
- 17917 Chase St
- 17800 Raymer St
- 8400 Chimineas Ave
- 8523 & 8521 Lindley Ave
- 9757 -9737 White Oak
- 9101 Geyser Ave
- 8903 Nestle Ave
- 8915 Nestle Ave
- 18251 Rayen St
- 8921 Nestle Ave
- 8914 Etiwanda Ave
- 18261 Rayen St Unit A
- 18261 Rayen St
- 8912 Nestle Ave
- 18233 Rayen St
- 8920 Etiwanda Ave
- 8927 Nestle Ave
- 18242 Rayen St
- 8920 Nestle Ave
- 18240 Rayen St
- 8926 Etiwanda Ave
- 18250 Rayen St
- 18234 Rayen St
- 18219 Rayen St
- 8933 Nestle Ave
- 18256 Rayen St
Your Personal Tour Guide
Ask me questions while you tour the home.