Estimated Value: $355,000 - $403,000
3
Beds
1
Bath
912
Sq Ft
$411/Sq Ft
Est. Value
About This Home
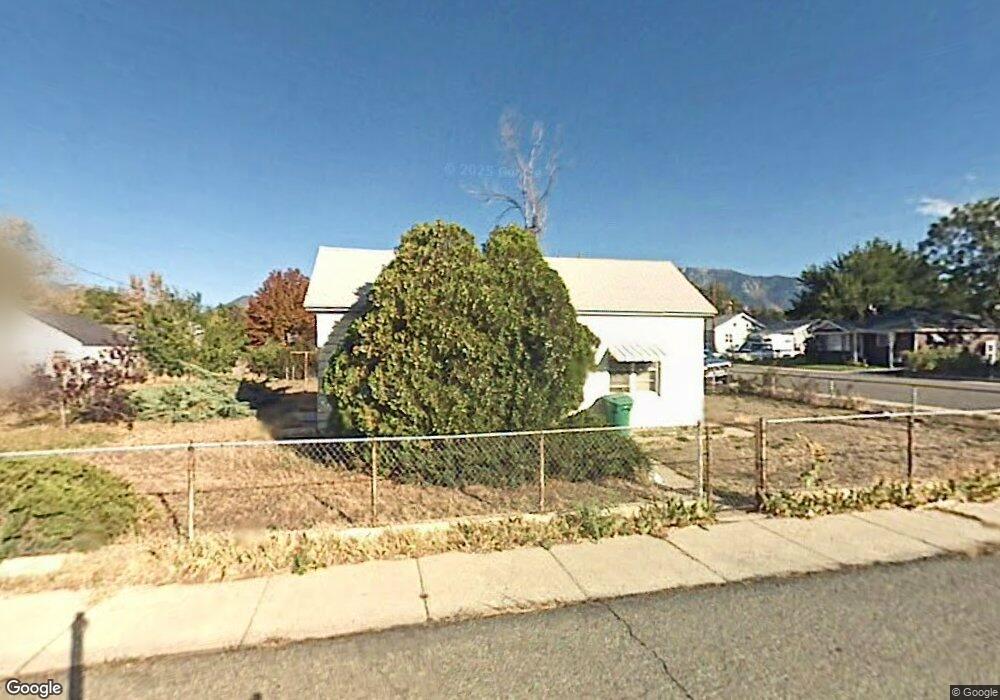
This home is located at 8909 S 220 E, Sandy, UT 84070 and is currently estimated at $375,159, approximately $411 per square foot. 8909 S 220 E is a home located in Salt Lake County with nearby schools including Sandy Elementary School, Mount Jordan Middle School, and Jordan High.
Ownership History
Date
Name
Owned For
Owner Type
Purchase Details
Closed on
Feb 22, 2016
Sold by
Ingham Joseph S
Bought by
Ingham Joseph Stacy
Current Estimated Value
Purchase Details
Closed on
Jun 19, 2015
Sold by
Burk Judy
Bought by
Ingham Joseph S
Purchase Details
Closed on
Jan 13, 2010
Sold by
Ingham Joseph S and Burk Judy
Bought by
Ingham Joseph S and Burk Judy
Home Financials for this Owner
Home Financials are based on the most recent Mortgage that was taken out on this home.
Original Mortgage
$53,350
Interest Rate
4.91%
Mortgage Type
New Conventional
Purchase Details
Closed on
Sep 30, 1997
Sold by
Ingham Joseph S
Bought by
Ingham Joseph S and Ingham Judy
Purchase Details
Closed on
Jul 9, 1997
Sold by
Olson Ruby
Bought by
Ingham Joseph S
Home Financials for this Owner
Home Financials are based on the most recent Mortgage that was taken out on this home.
Original Mortgage
$58,950
Interest Rate
7.93%
Create a Home Valuation Report for This Property
The Home Valuation Report is an in-depth analysis detailing your home's value as well as a comparison with similar homes in the area
Home Values in the Area
Average Home Value in this Area
Purchase History
| Date | Buyer | Sale Price | Title Company |
|---|---|---|---|
| Ingham Joseph Stacy | -- | None Available | |
| Ingham Joseph S | -- | Accommodation | |
| Ingham Joseph S | -- | First American Title Ohio | |
| Ingham Joseph S | -- | -- | |
| Ingham Joseph S | -- | -- |
Source: Public Records
Mortgage History
| Date | Status | Borrower | Loan Amount |
|---|---|---|---|
| Previous Owner | Ingham Joseph S | $53,350 | |
| Previous Owner | Ingham Joseph S | $58,950 |
Source: Public Records
Tax History
| Year | Tax Paid | Tax Assessment Tax Assessment Total Assessment is a certain percentage of the fair market value that is determined by local assessors to be the total taxable value of land and additions on the property. | Land | Improvement |
|---|---|---|---|---|
| 2025 | -- | $353,300 | $134,500 | $218,800 |
| 2024 | -- | $299,300 | $123,400 | $175,900 |
| 2023 | $21 | $276,000 | $117,300 | $158,700 |
| 2022 | $21 | $287,500 | $115,000 | $172,500 |
| 2021 | $14 | $232,500 | $90,000 | $142,500 |
| 2020 | $1,452 | $209,900 | $90,000 | $119,900 |
| 2019 | $37 | $185,700 | $90,000 | $95,700 |
Source: Public Records
Map
Nearby Homes
- 8558 S Center St
- 270 E 8680 S
- 112 E 8680 S
- 412 E 8760 S
- 362 E 9150 S
- 220 E Pioneer Ave
- 194 Pioneer Ave
- 149 E Pioneer Ave
- 87 Pioneer Ave
- 87 W 8710 S
- 8732 S 620 E
- 227 E St Germain Way
- 8470 Solar Way
- 8459 S 300 E
- 487 E 9270 S
- 37 Crawford Place
- 627 E 8680 S
- 140 W 8710 S
- 359 E 8400 S
- 8812 S Stratford Cir
Your Personal Tour Guide
Ask me questions while you tour the home.